
Purpose of Service Level Objectives
We believe that the following three aspects are critical to retaining and further improving the customer’s trust for a SaaS vendor such as Cloudentity:
- Continuously improving system reliability
- Reliable risk control
- Increasing development iteration speed
These goals are only achievable if we have an accurate method of measuring the customer experience and how is it affected as we make changes. We can achieve this by defining Service Level Objectives (SLOs).
Thank to SLOs, we can measure the business impact of our services’ reliability. We can also decide which services should be prioritized for development by targeting lowest reliability first. That gives us the much needed risk management edge.
Before we go deeper into Service Level Objectives, we recommend reading the Implementing SLOs chapter of the Google SRE workbook, which inspired our SLO implementation.
All the key concepts, such as Service Level Indicators (SLIs), Service Level Objectives (SLOs), Service Level Agreements (SLAs) came from Software Risk Management introduced by Google SRE.
Basic definitions related to SLOs:
-
Critical User Journey is any user-facing core feature, for example the OAuth 2.0 authentication flow.
-
Service Level Indicators (SLI) are measurements that can be used to determine if a system is healthy from the end-user perspective (i.e., “Percentage of succeeded requests” or “Latency of a request”).
-
Service Level Objectives (SLO) defines the availability goal for a system based on SLIs (i.e., “99.5% of requests must succeed” or “99% of requests must not take longer than 100ms”).
-
Service Level Agreements (SLA) defines a legally binding contract with the customer about a set of SLOs (i.e., “If less than 99.99% of requests to your API succeed, a refund will be issued”). An SLO is agreed within the SLA as an obligation, because it can be met or not for specific reasons under defined conditions, and is expressed within a particular time frame.
-
Error Budget, derived from an SLO, is the amount of time per period (usually the period is 30 or 365 days) during which a service can violate its target SLO.
SLAs? Wait, can’t we rely on our existing monitoring system?
We manage three logical application regions: the United States, Europe, and Australia. It means even more physical regions (we are even ready to handle the downtime of the whole AWS region) and dozens of services in several Kubernetes clusters. We already have Thanos (Prometheus) monitoring with predefined alerts for applications and infrastructure. Defining alerts on the rate of application errors originally seemed reasonable.
After some time, however, we discovered that such a move was unwise. We experienced many false positives, and often for every component, we had alerts raised, each one being a unique case.
Our Implementation
At Cloudentity, we identified a few Service Level Indicators (SLIs) which are essential for our users and ourselves.
Let’s follow up with an example. Our users interact with the system primarily via APIs. Therefore, we have decided to track availability and latency SLIs. Additionally, we went one step further. We put great importance on our Operations processes, striving for a high number of successful deployments to production environment while keeping the time required for test execution at the necessary minimum.
Choosing the Tools
Having done our research, we decided to use a tool called Sloth to help us standardize generating SLOs for Prometheus. We integrated Sloth with our High Availability Monitoring Infrastructure, based on Thanos, Prometheus and Grafana. Thanos ruler evaluates the rules and sends alerts to Alertmanager. Alertmanager alerts our team members when necessary using Slack channels and Pagerduty. Our team is therefore aware of an incident as soon as it happens.
Initial Implementation
We chose availability as the first SLI to implement. To measure this SLI, we chose the Success Rate as a metric, represented as the following formula (Thanos query):
-
Success metric formula:
sum(sum by(status_code)(sum_over_time(acp_http_duration_seconds_count{env=~"prod",status_code!="(5..)"}[{{.window}}]))) -
Total requests formula:
sum(sum by(status_code)(sum_over_time(acp_http_duration_seconds_count{env=~"prod"}[{{.window}}])))
We are combining these formulas within a Sloth SLO manifest similar to the one below:
apiVersion: openslo/v1alpha
kind: SLO
metadata:
  name: requests-availability
  displayName: Common SLO based on availability for HTTP request responses
spec:
  service: acp
  budgetingMethod: Occurrences
  objectives:
    - ratioMetrics:
        good:
          source: prometheus
          queryType: promql
          query: sum(sum by (status_code)(sum_over_time(acp_http_duration_seconds_count{env=~"prod",status_code!="(5..)"}[{{.window}}])))
        total:
          source: prometheus
          queryType: promql
          query: sum(sum by (status_code)(sum_over_time(acp_http_duration_seconds_count{env=~"prod"}[{{.window}}])))
      target: 0.9999
  timeWindows:
    - count: 30
      unit: Day
You can find more examples in Sloth documentation.
Grafana Dashboards
Having retrieved our availability data, we now need to visualize it. Sloth offers two ready-to-go Grafana Dashboards which help us achieve that:
-
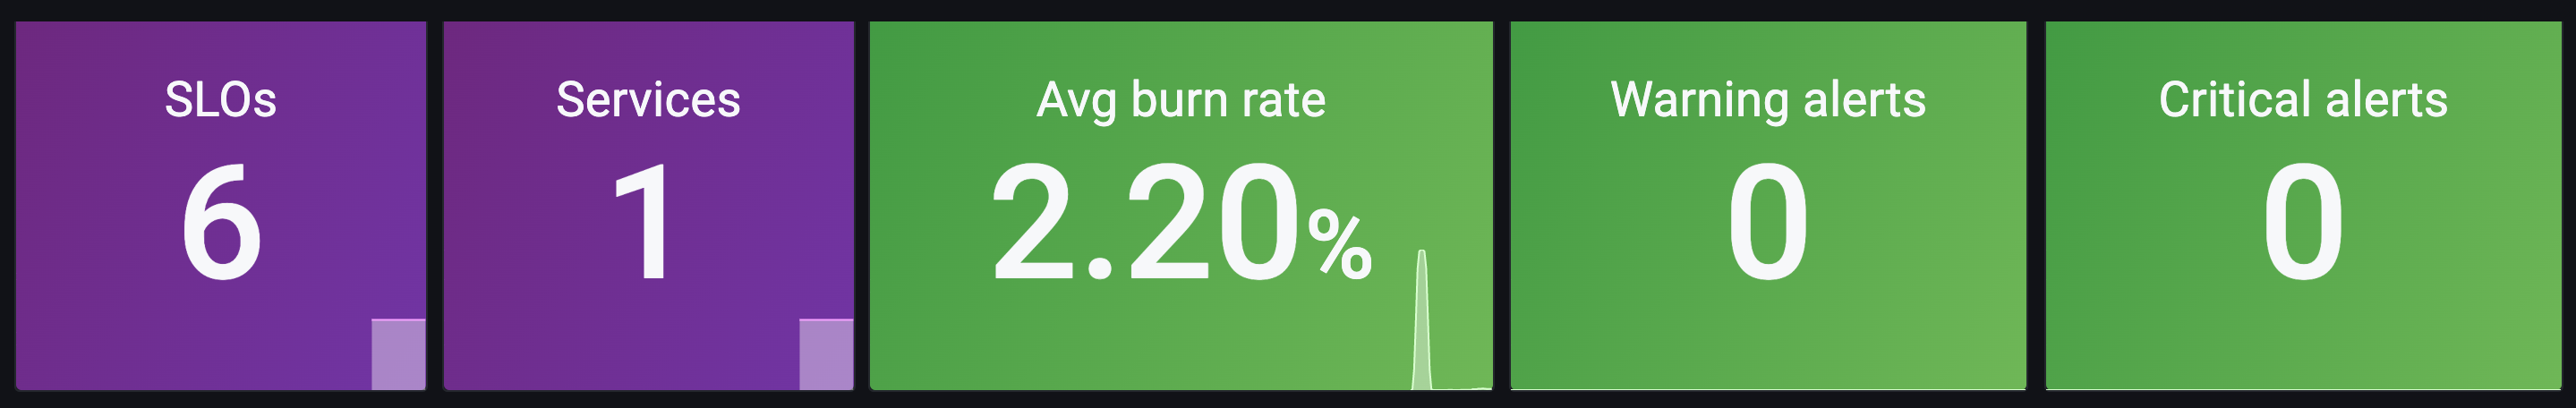
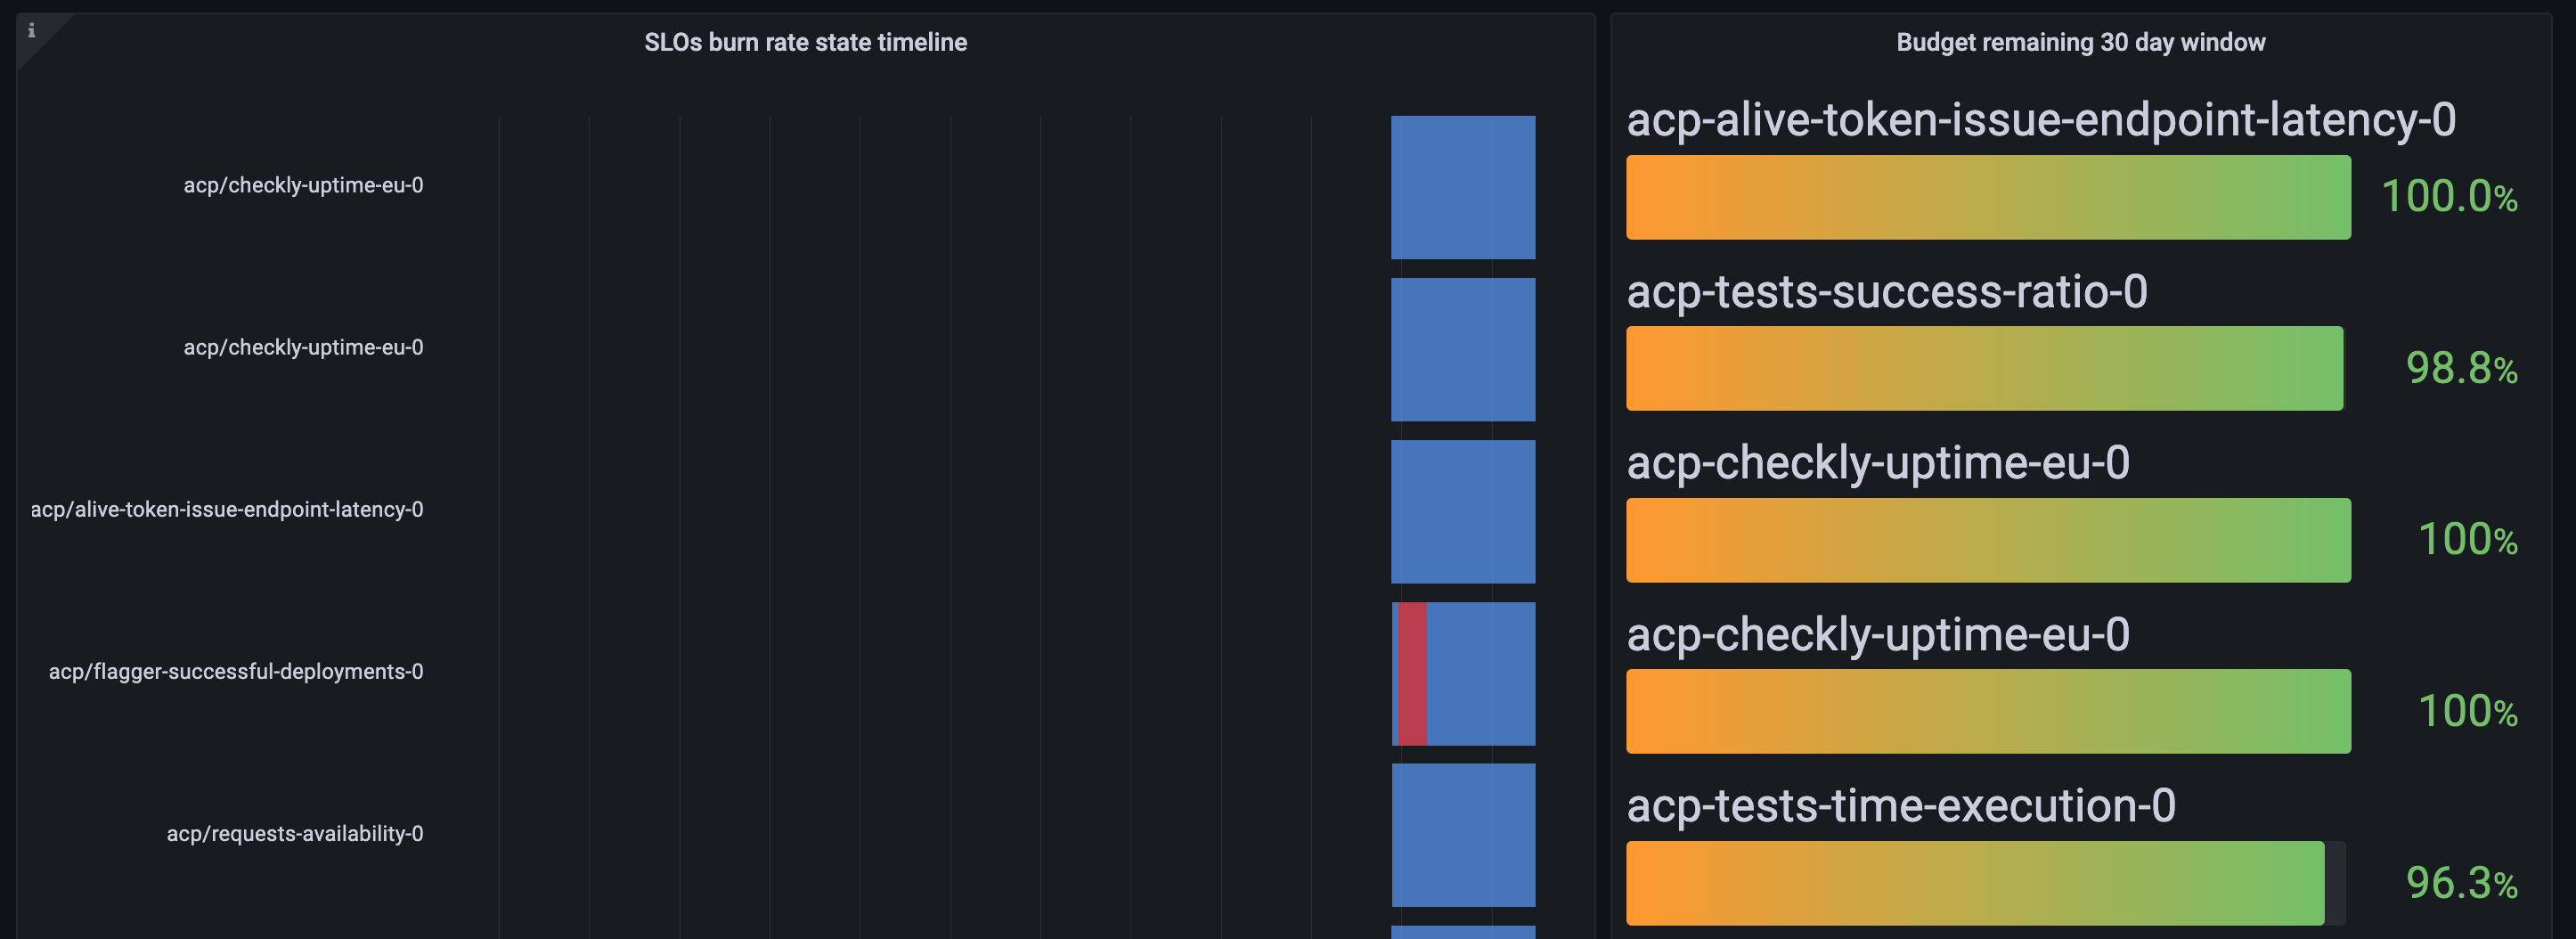
High-level overview
This dashboard shows a high-level overview of all the SLOs in the system managed by Sloth. It can be found on the dedicated Grafana page.
-
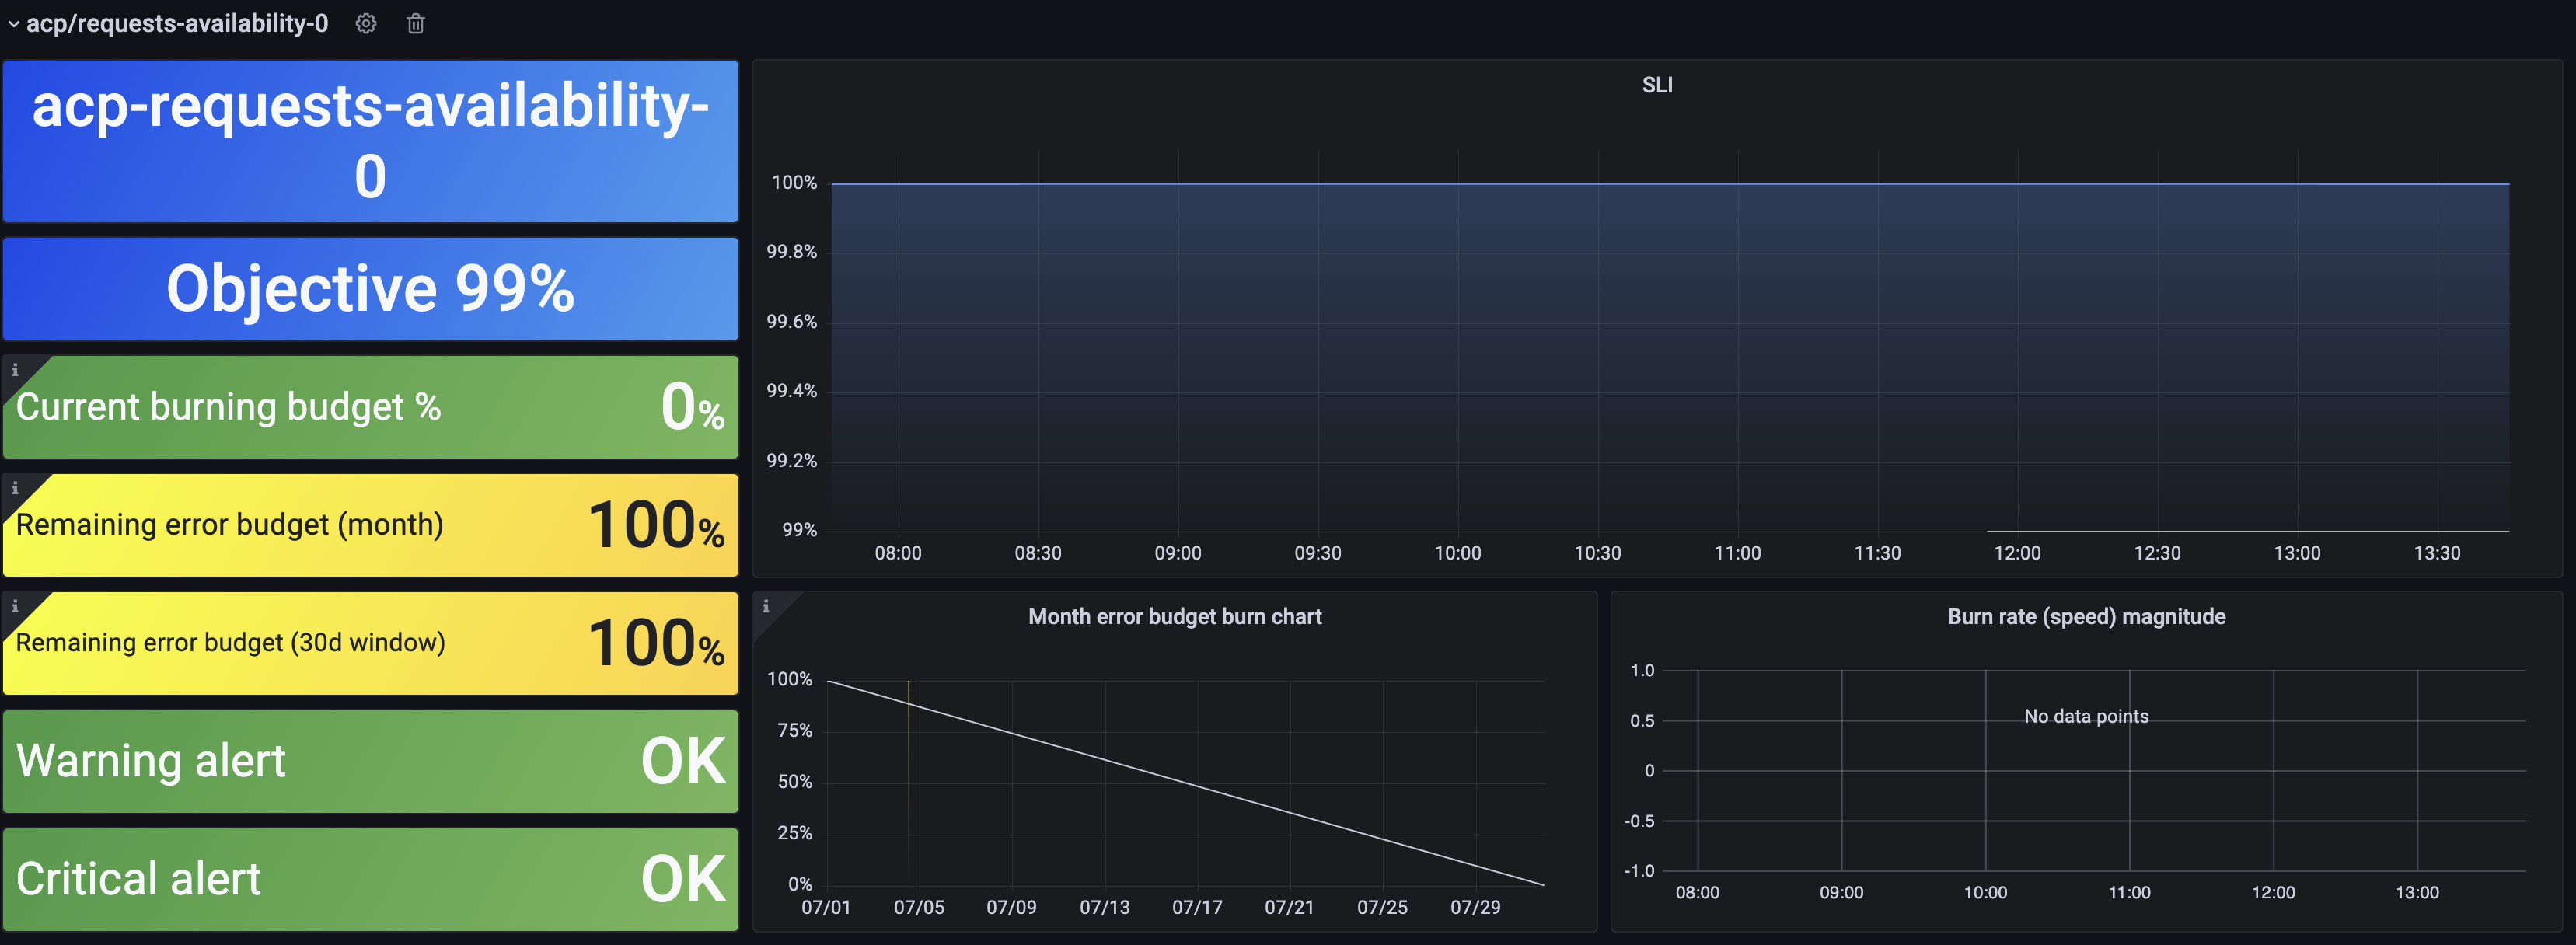
Detailed SLOs
This dashboard provides a detailed view of each of the implemented SLOs. You can download it from its dedicated Grafana page.
What else could be an SLO?
Apart from the availability metrics, we have implemented multiple other SLOs, including the following:
- API endpoint latency
- Website uptime
- Ratio of successful tests
- Ratio of successful deployments
We hope these examples give you an idea for an SLO of your own.
Benefits of SLOs for Cloudentity
SLOs help us find answers to the following questions and therefore helps improve visibility and decision-making:
- What is the reliability of our services?
- What should we prioritize: investment in new features or tackling technical debt?
- How much money are we losing because of reliability issues?
SLOs help manage developer assignments by providing the error budget. Having this data, engineers can decide to take a more risky approach if there is plenty of budget remaining or inform the teams that, according to the reliability goal, there’s no more space for reliability degradation, and therefore a more conservative approach is needed.
SLOs reduce Alert Fatigue. Fixed threshold-based alerts are challenging to keep up to date with. As time goes on, developers learn to ignore them, because they lack context about the impact on customer experience.
Our customers do not care if the CPU consumption is at 80% — a typical alert threshold. On-call engineers won’t be happy either if they are notified at 3 a.m. only to find out there’s been a temporary spike in CPU usage.
A relevant alert should notify an engineer only if there is a degradation that causes an actual impact on the reliability goal. SLO-based metrics help us achieve that.
SLOs reveal degradations early by showing how service components are performing relative to their target performance. SLOs are the best source of truth when it comes to finding degradations impacting customers.
Conclusion
We managed to get the SLO alerting working for our platform’s availability and latency SLIs. We maintained all the “legacy” component alerts along with the new SLO-based alerts, but we’re planning to lower their severity. We are happy with SLOs due to fewer notifications and reduced number of false positives when compared to threshold-based metrics.
Thanks to SLOs, we could see how much our users were affected by reliability issues since their implementation. This lead us to significant improvements of the visibility of the product stability over time for all involved parties — developers, operations (SRE), and most importantly, Product Owners who are now in charge of the desired level of quality of the product they are responsible for. Finally, we saw a vast improvement in the quality of our product and learned that it is possible to improve quality even further using SLOs.
Like what you see? Register for free to get access to a Cloudentity tenant and start exploring our platform!