
About Smoke Testing
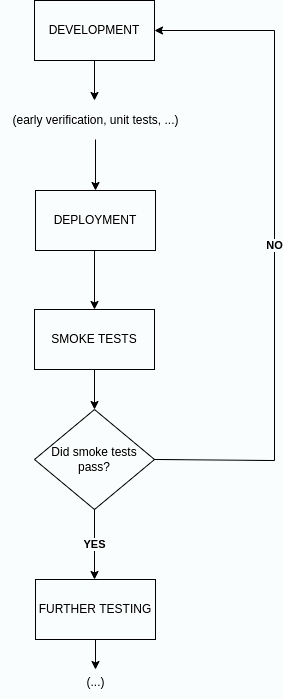
Smoke testing is a process of checking whether the core features of our deployed software are functional.
The name smoke test comes from electronic hardware testing. If you turn on your device and see the smoke, your testing is finished as the device is clearly broken - it is a good analogy to what is happening in the area of software testing.
If the smoke tests prove that the basic features of our software are broken, any further work on the current build is a waste of time. We already know it needs to be fixed. Thanks to the smoke tests, we know this right after the deployment.
Smoke Test Importance in Cloudentity SaaS
The Cloudentity platform needs to be available 24/7, as it is actively used by multiple customers from different time zones at the same time. In order to provide our customers with the best possible experience, we must constantly check the stability of all the basic functionalities in real time. In case of any trouble, we must be able to react quickly, and assign issues to the right people, to get them resolved as soon as possible.
With this in mind, we created our smoke test framework, which makes our work easier and more effective.
Our smoke tests help to determine if the most important functionalities of the software deployed in SaaS environment work as expected. If these functionalities crash, we know for sure that our software has a serious bug that may affect the business real-time. Finding such bugs right after they are introduced saves a lot of time and resources.
How our Testing Solution Works
Our smoke testing solution consists of three core elements:
-
Continuous Testing Solution - where tests are running in an infinite loop every ~2 minutes.
-
Canary Testing Solution - where tests are running on demand, triggered by Flagger.
-
Monitoring & Real-Time Alerts - advanced reporting, sending SMS/e-mail notifications to responsible engineers.
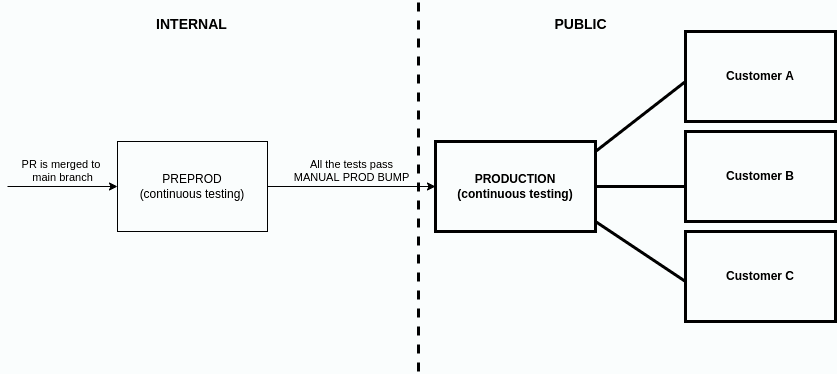
The tests are running on 2 separate cloud environments: PREPROD (pre-production) and PROD (production).
The purpose of PREPROD testing is to check if our new functionalities work on SaaS. PREPROD is not public - it’s a part of our internal network, so any outages and errors are not visible to our clients.
The purpose of PROD testing is to check if our existing functionalities work in real time in SaaS, without any outages and errors. This is the final verification point for Cloudentity. PROD is simply our production environment, so any problems there are visible to our clients. It is crucial to find problems on earlier stages.
Tests are running on all the AWS regions used by our clients. Each region has its own dedicated testing pod.
Example Test Cases
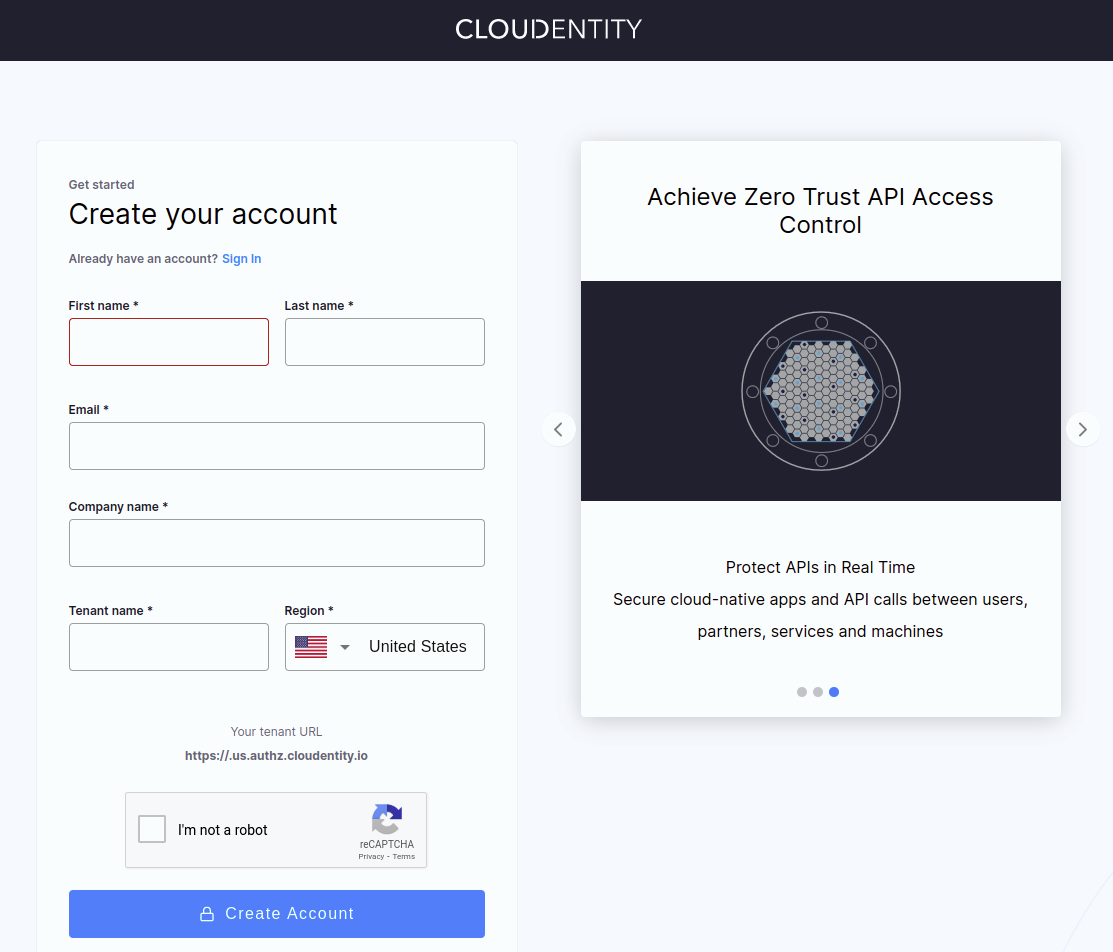
Example 1: Registration flow
The purpose of registration tests is to follow the full tenant/user registration flow, including legacy tenant removal, new tenant creation, and activation via e-mail.
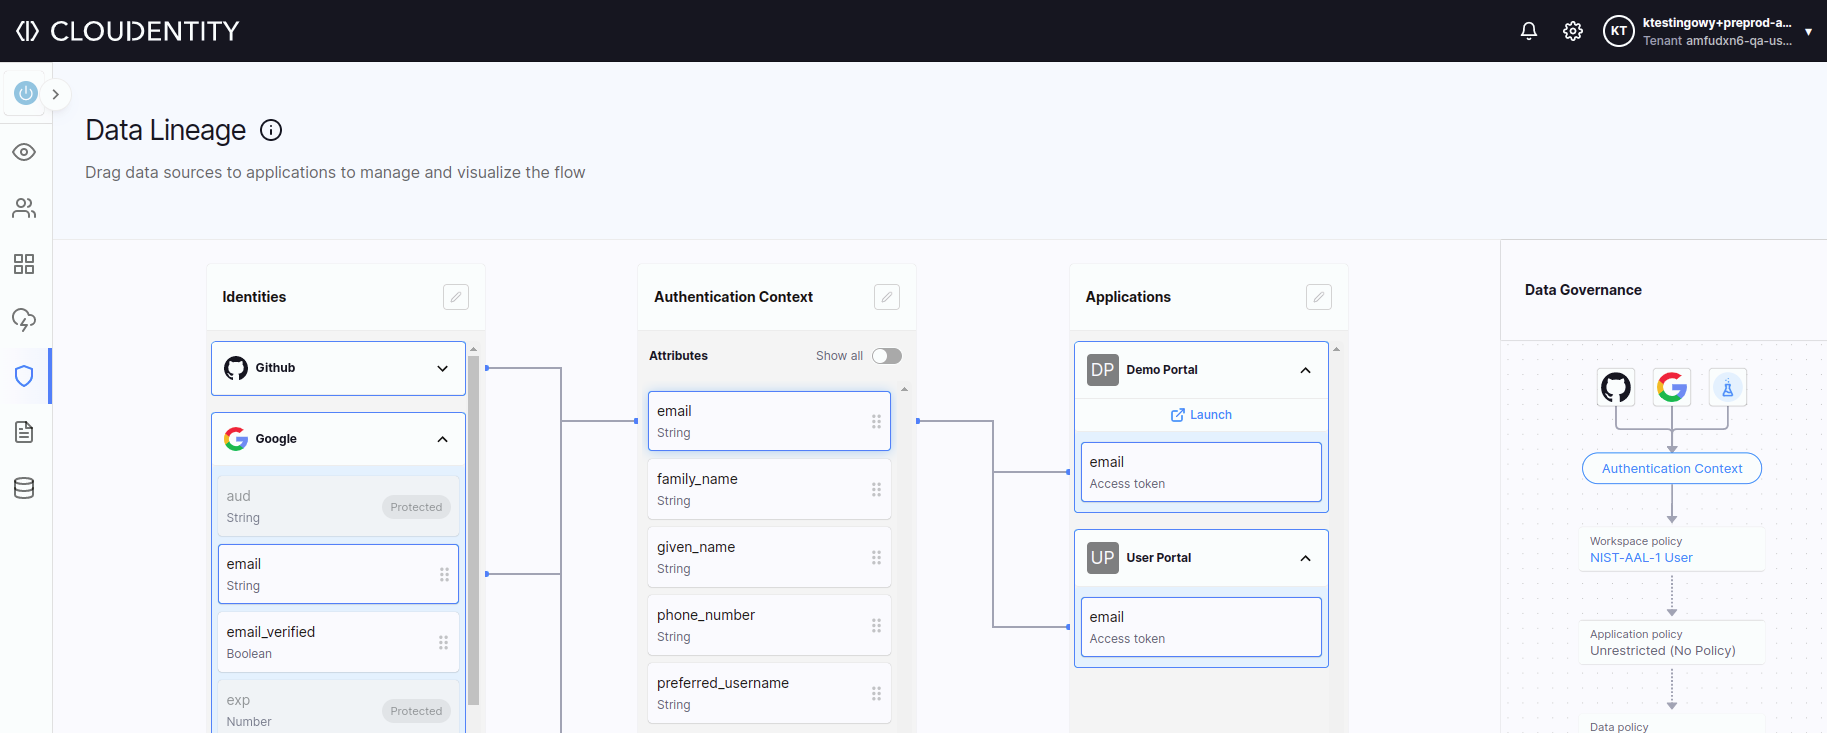
Example 2: Visiting Cloudentity pages
The purpose of these tests is to make sure that all the Cloudentity pages and tabs open successfully.
Test Data Preparation
Our tests are expected to be lightweight and run quickly in a loop. That means we need to take care of their performance to make sure they do not affect our resources too much.
Usually, the most time-consuming steps are the environment setup and the preparation of test data. We needed to perform these steps as quick as possible, leading to following rules:
-
Every user is created only once. Tests keep re-using the users in all iterations, they do not delete and re-create any of them.
-
Test data is not being created and/or destroyed on each iteration. The only exception is registration test, since it creates a new tenant.
-
Our tests are running on PREPROD and PROD environments. Each of them is configured to run on certain regions. The tests need separate users for each permutation of environment and region, e.g. preprod + us-east-1, preprod + eu-west-1, prod + us-east-1, etc.
Basic View on Our Infrastructure
Our tests in SaaS are running as a part of a dedicated testing pod, inside our Kubernetes cluster.
The testing pod called acp-tests consists of:
-
Container with tests - a dockerized Java-based application. It is the test execution container within the testing pod.
Stack: Java 8 + Maven + Selenium + TestNG + REST Assured, Docker/Docker-compose, Servlet container: Jetty, Exposed endpoints:
/alive,/metrics,/logs,/canary,/validate -
standalone-chromeis a Selenium packed together with Node and Hub -
Reporting Service - a Docker library that helps serving the test reports, the main tool is allure-docker-service.
To make sure that our testing pod works as expected, we use Liveness, Readiness, and Startup probes:
│     Liveness:   http-get http://:4321/alive delay=5s timeout=5s period=60s #success=1 #failure=2                                                                                                                                                                                       │
│     Readiness:  http-get http://:4321/metrics delay=0s timeout=3s period=5s #success=1 #failure=2                                                                                                                                                                                      │
│     Startup:    http-get http://:4321/params/validate delay=0s timeout=3s period=5s #success=1 #failure=3
Reporting Service has access to the persistence volume claim, which is used to write results to the volume. After writing, Reporting Service has the possibility to generate reports.
Based on that, we have the possibility to serve the historical reports.
apiVersion: v1
kind: PersistentVolumeClaim
metadata:
  name: acp-tests-pv-claim
spec:
  resources:
    requests:
      storage: 100Gi
  storageClassName: gp3
We are also using Flux for Cloudentity continuous deployment in the cluster:
NAMESPACE   NAME                        REVISION                            SUSPENDED READY  MESSAGE
flux-system acp-tests-canary            feature/dev/bb540d6 False    True   Applied revision: feature/dev/bb540d6
flux-system apps                                                            False    Unknown running health checks with a timeout of 30s
flux-system cluster                     feature/dev/bb540d6 False    True   Applied revision: feature/dev/bb540d6
flux-system external-dns                                                    True     False   waiting to be reconciled
flux-system flux-system                 feature/dev/bb540d6 False    True   Applied revision: feature/dev/bb540d6
flux-system infrastructure              feature/dev/bb540d6 False    True   Applied revision: feature/dev/bb540d6 (...)
Our passwords and keys are safely stored as secrets. Encryption is solved using Mozilla SOPS.
apiVersion: v1
kind: Secret
metadata:
  name: acp-tests-allure-secret
  namespace: acp-tests
type: Opaque
data:
  securityUser: ENC[AES256_GCM,data:QxOAGCxcs2UmDRwr,iv:5f2agH/Z2DEgsd3slCGtL5eHk/Av6kO7eUZ/Jq/D43o=,tag:j6SidTLzWWrLkanvORjatw==,type:str]
  securityPass: ENC[AES256_GCM,data:1rho8xdPvvSViHm4Z13r48CKgp0=,iv:aVWO0DvMcWrL8Ut+xkKuikxps+TWyDMrvlgDvhGjr9A=,tag:xz+BfDpyBr3/5bKoz0NZgA==,type:str]
sops:
Continuous Deployment
In this section, we’ll give an overview of the Continuous Deployment of our acp-tests pod.
Jenkins Pipeline for ACP
acp-tests application’s source is in the main product’s Git Repository. Based on that Git repository,
the Jenkins pipeline is implemented. The purpose of this pipeline, among others, is to:
-
Package Cloudentity into Docker in order to test the latest commit
-
Run tests on different levels (unit, integration, pipeline-smokes, e2e, and more)
-
Package the container with tests into Docker
-
Tag and push Docker images into the Docker registry
The key output of this pipeline in the context of Continuous Deployment is the fact that
we have the newest versions of Docker images available in the Docker registry.
The Docker image tag format must be dev-<date_YYYYMMDD>-<time_HHMMSS>-<commit_HASH>, as in:
dev-20220614-093728-7zf8b4a
The tag format is important for Flux, because Flux scans Docker images by their branch name (the
most common use case is dev) and by the date-time pattern.
Flux in our Saas Repository
Our SaaS repo is a GitOps repository for Cloudentity SaaS continuous delivery. In our CD process, among others, we’re using Flux. Flux is responsible for automated image updates. It scans the Docker registry for the newest Docker images. When they appear, Flux automatically commits changes to the Git Repository in appropriate locations, changing the version of the Docker image to the newer one. These locations are labeled as Flux image policies.
Below, you can see an example commit:

The next feature of Flux is the reconciliation process. Flux has a listener for the main branch of
our SaaS Git repository. Whenever a new change appears, Flux synchronizes itself with the latest
commit. The bumping process of acp-tests pod is then started automatically in our Kubernetes
infrastructure.
Blue Green Deployments
In Cloudentity, in the Continuous Deployment process, we’re using Flagger. With Flagger, we have the possibility to deploy our main service (Cloudentity) using Blue Green Deployment strategy. Our main Quality Gate in that process are metrics produced by the new Cloudentity service.
To that end, we have another test application called acp-tests-canary, next to “common”
acp-tests. It is another pod
responsible for running
a different kind of smoke tests on a mode called “canary”. The
main difference compared to “common” acp-tests is the fact that the application does not run
smoke tests regularly, every few minutes. Instead, it runs them on demand. The /canary endpoint is
enabled in this mode, and the only way to trigger the tests is via HTTP POST call to the /canary endpoint.
Below, you can examine such a call:
curl -i -k --header "Content-Type: application/json" \
  --request POST \
  --data '{
      "metadata": {
             "internalTestServiceBaseUrl": "https://acp-canary.acp.svc:8443",
             "acpTestsUserIndex" : "2c",
             "isTriggeredByFlagger": false
    }
}' \
  https://acp-tests-canary.local:9443/canary
The next main difference between “common” SaaS smoke tests and canary smoke tests is the fact that
the canary tests hit directly into the internal service URL. In the example above, we’re hitting
directly to
a specific Cloudentity service on Kubernetes https://acp-canary.acp.svc:8443. We’re
checking the
quality of this specific service, which is in the Blue Green Deployment process.
Currently, Flagger is responsible for triggering webhooks in the blue/green deployment process.
A webhook is created in order to hit the acp-tests-canary pod with the necessary metadata JSON. Each
Flagger iteration triggers one iteration of canary tests.
  apiVersion: flagger.app/v1beta1
kind: Canary
metadata:
  name: acp
spec:
# ...
  analysis:
    interval: 45s
    iterations: 10
    threshold: 2
    webhooks:
# ...
      - name: acp-tests-canary
        type: rollout
        url: http://loadtester/
        timeout: 5s
        metadata:
          type: bash
          cmd: 'curl -i --header "Content-Type: application/json"
          --request POST --data ''{ "metadata":
          {  "internalTestServiceBaseUrl": "https://acp-canary.acp.svc:8443" ,
           "acpTestsUserIndex": "1c" ,
           "isTriggeredByFlagger": true }}''
           http://acp-tests-canary.acp-tests:4321/canary'
When Flagger triggers this webhook - canary smoke tests start.
acp-tests-canary produces metrics when canary smoke tests are finished. Based on those metrics,
we’re able to determine if Blue/Green Deployment can end with a success or not.
If successful, a bump of the Cloudentity version begins.
Basic metrics which check the quality of blue-green deployment of Cloudentity are as follows:
-
Availability of
acp-tests-canarymetrics -
The ratio of failed tests to all tests of
acp-tests-canarymetrics -
p90 latency of
acp-canary. p90 latency is the highest latency value (slowest response) of the fastest 90 percent of requests measured. -
The ratio of
5xxstatus codes ofacp-canary
Below, you can examine part of the logs from Flagger which are informing us about a positive deployment:
  │ {"level":"info","ts":"2022-06-13T11:45:29.960Z","caller":"controller/events.go:33","msg":"Starting canary analysis for acp.acp","canary":"acp.acp"}                                                                                                                                    │
  │ {"level":"info","ts":"2022-06-13T11:45:30.049Z","caller":"controller/events.go:33","msg":"Pre-rollout check check-alive passed","canary":"acp.acp"}                                                                                                                                    │
  │ {"level":"info","ts":"2022-06-13T11:45:30.064Z","caller":"controller/events.go:33","msg":"Advance acp.acp canary iteration 1/10","canary":"acp.acp"}                                                                                                                                   │
  (...)

  │ {"level":"info","ts":"2022-06-13T11:53:40.128Z","caller":"controller/events.go:33","msg":"Advance acp.acp canary iteration 10/10","canary":"acp.acp"}                                                                                                                                  │
  │ {"level":"info","ts":"2022-06-13T11:55:10.538Z","caller":"canary/config_tracker.go:352","msg":"ConfigMap acp-data-primary synced","canary":"acp.acp"}
  │  # other stuff
  | {"level":"info","ts":"2022-06-13T11:57:30.080Z","caller":"controller/events.go:33","msg":"Promotion completed! Scaling down acp.acp","canary":"acp.acp"}
Similarly, we can show you part of the logs from Flagger which are informing us about a failed deployment:
│ {"level":"info","ts":"2022-06-13T09:17:00.092Z","caller":"controller/events.go:33","msg":"Advance acp.acp canary iteration 1/10","canary":"acp.acp"}                                                                                                                              │
│ {"level":"info","ts":"2022-06-13T09:20:40.026Z","caller":"controller/events.go:33","msg":"Advance acp.acp canary iteration 5/10","canary":"acp.acp"}                                                                                                                                   │
│ {"level":"info","ts":"2022-06-13T09:21:40.026Z","caller":"controller/events.go:45","msg":"Halt acp.acp advancement ACP TESTS CANARY TEST METRICS AVAILABILITY 0.00 < 0.01","canary":"acp.acp"}                                                                                         │
│ {"level":"info","ts":"2022-06-13T09:22:10.034Z","caller":"controller/events.go:45","msg":"Halt acp.acp advancement ACP P90 Latency 503.84 > 500","canary":"acp.acp"}                                                                                                                   │
│ {"level":"info","ts":"2022-06-13T09:22:14.844Z","caller":"controller/events.go:45","msg":"Rolling back acp.acp failed checks threshold reached 2","canary":"acp.acp"}                                                                                                                  │
│ {"level":"info","ts":"2022-06-13T09:22:14.844Z","caller":"controller/events.go:45","msg":"Canary failed! Scaling down acp.acp","canary":"acp.acp"}
Thanks to Flagger and acp-tests-canary (a tool used in the Blue/Green deployment process), we can
implement another quality gate and enhance our safety net. Therefore, we can now have even more
confidence in the automated release process of our product!
Monitoring
In this section, we will describe how the monitoring for our solution works.
Metrics
In Cloudentity, we have a rich monitoring layer that helps us with quality awareness.
We’ve built a lot of dashboards, alerts, and notifications based on Prometheus metrics. Our
test applications, acp-tests and acp-tests-canary, are good examples of metrics producers. These
applications are
also metrics exporters. After each test, and after each test iteration, Prometheus metrics are
prepared and fetched. Based on those metrics we’re able to prepare a lot of information.
Metrics are available under the /metrics endpoint, for example:
# HELP jvm_memory_bytes_used Used bytes of a given JVM memory area.
# TYPE jvm_memory_bytes_used gauge
jvm_memory_bytes_used{area="heap",} 5.6828584E8
jvm_memory_bytes_used{area="nonheap",} 2.10408464E8
# HELP jvm_memory_bytes_committed Committed (bytes) of a given JVM memory area.
# TYPE jvm_memory_bytes_committed gauge
jvm_memory_bytes_committed{area="heap",} 9.83896064E8
jvm_memory_bytes_committed{area="nonheap",} 2.38338048E8
# HELP jvm_memory_pool_bytes_committed Committed bytes of a given JVM memory pool.
# TYPE jvm_memory_pool_bytes_committed gauge
jvm_memory_pool_bytes_committed{pool="Code Cache",} 1.00532224E8
jvm_memory_pool_bytes_committed{pool="Metaspace",} 1.22904576E8
jvm_memory_pool_bytes_committed{pool="Compressed Class Space",} 1.4901248E7
jvm_memory_pool_bytes_committed{pool="Eden Space",} 2.71581184E8
jvm_memory_pool_bytes_committed{pool="Survivor Space",} 3.3882112E7
jvm_memory_pool_bytes_committed{pool="Tenured Gen",} 6.78432768E8
# HELP acp_tests_TEST_NAMES_WITH_ALL_STATUSES Metric which hold number of all test names with their status (SKIPPED(1), FAILED(2) PASSED(3)). It is for QA to easily determine which tests failed on iteration
# TYPE acp_tests_TEST_NAMES_WITH_ALL_STATUSES gauge
acp_tests_TEST_NAMES_WITH_ALL_STATUSES{tests_names_with_statuses="SmokeVisitAcpSettingsTest.visitAcpTokensWorkspaceSettingsPage",test_application_mode="basic",is_triggered_by_flagger="false",acp_tests_version="8f441be-2022-06-13-17-50",} 3.0
Besides metrics related to testing scenarios, we have metrics to help us determine the healthiness of our test applications. We also have metrics related to:
-
Actual resources usage (container CPU/container RAM, JVM metrics)
-
Persistence Volume Space Usage (PVC used as a storage for historical Allure Reports)
-
Blue Green Deployments (Flagger statuses of the deployments)
and many more.
Grafana Dashboards
The everyday routine for some of our QAs is to visit a few Grafana dashboards and check if everything
was/is “green”. For example, see the acp-tests dashboard displayed below:
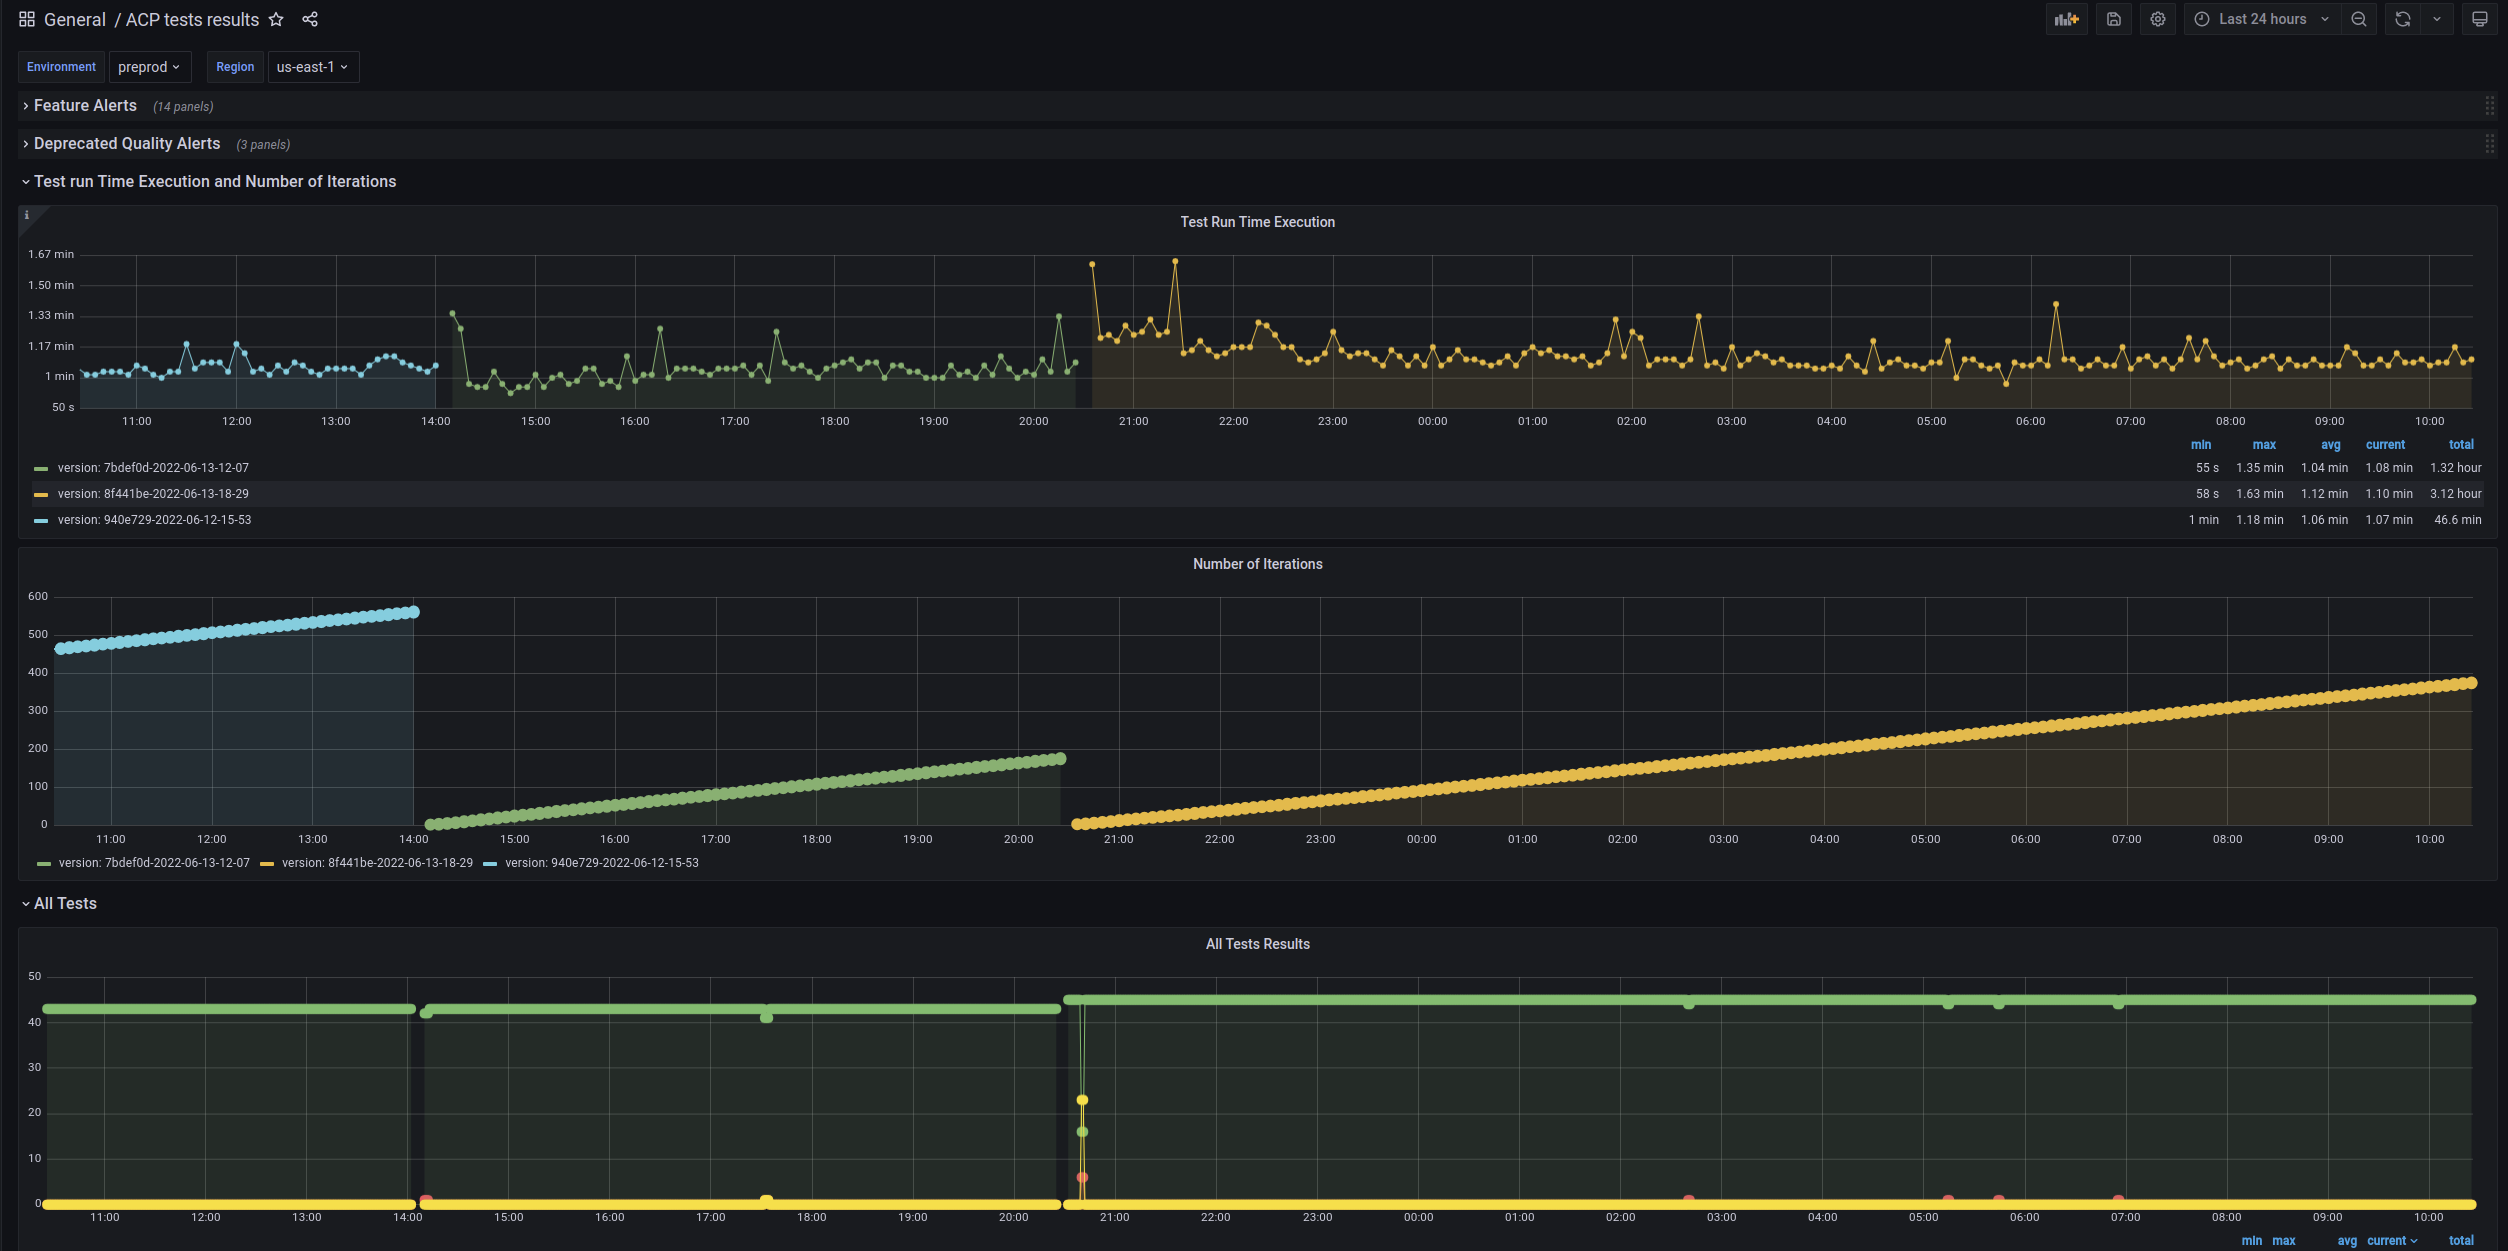
Those charts provide us with some useful information:
-
Test iteration time is around 1 minute
-
Iteration count is constantly growing
-
There were a few deployments of new versions of
acp-testsduring the last 24 hours (iterations count from 1 again) -
Most of the time, all tests (around 40) are green
-
The number of all tests increases, so we see that QAs who constantly work on smoke tests are implementing new scenarios
-
To monitor which tests are failing, we have dedicated Slack notifications and Allure Reports.
Slack Notifications
There are also other uses for acp-tests metrics, such as notifications on Slack for the
development team. Notifications are based on defined alerts from Alert Manager from the Prometheus
ecosystem, spawning on the dedicated slack channel.
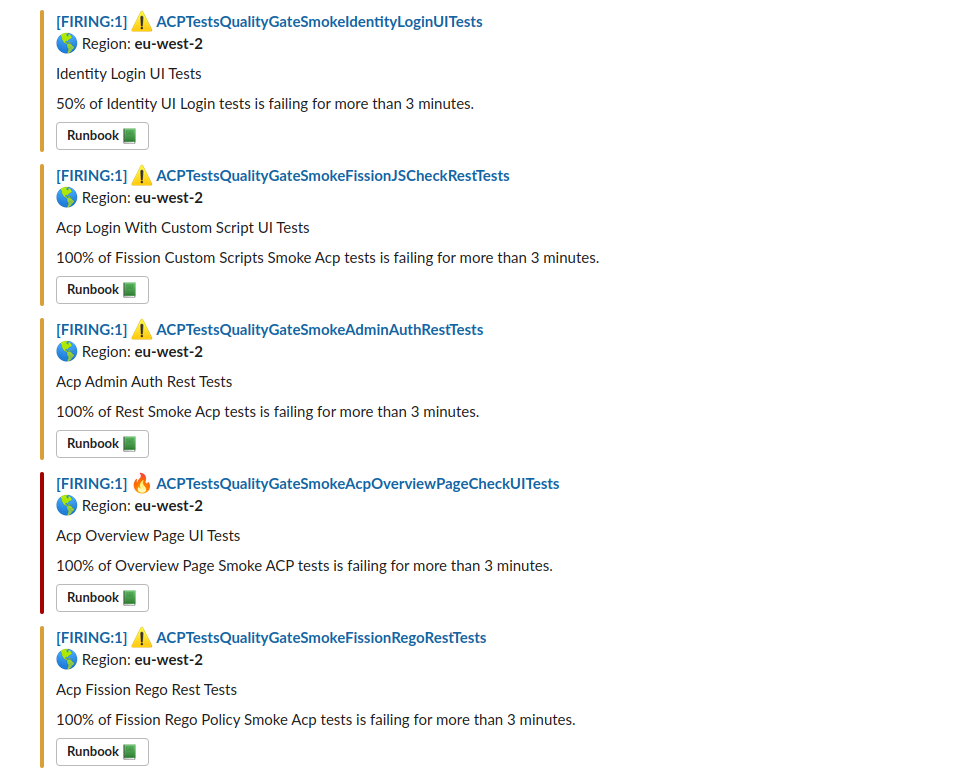
Therefore, we know in which region and environment the tests start to fail. We are maintaining documentation for internal procedures, telling everyone what to do if it happens. We can find even more information and logs related to failing tests using ElasticSearch and Dynamically Generated Allure Reports.
PagerDuty Incidents
Another consumer of metrics is PagerDuty Incidents. Based on alerts from the Alert Manager, when an alert has the appropriate severity - The Pager Duty incident can be spawned.
Support engineers who are on duty when the incident happens receive an e-mail or a text message.
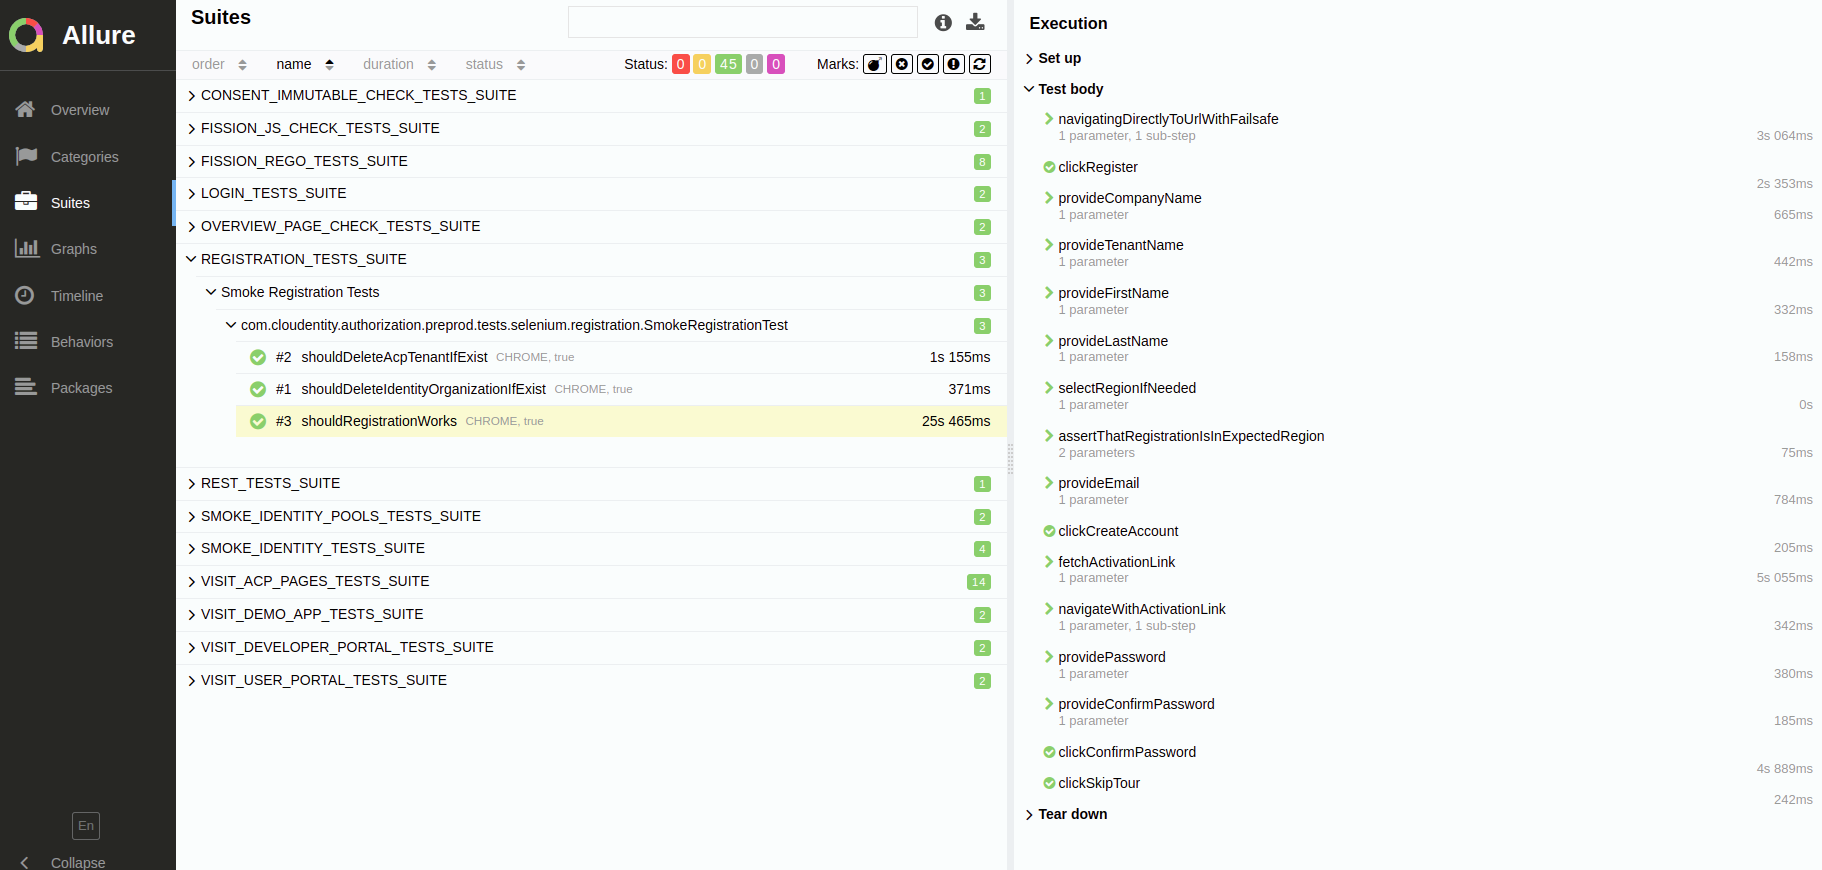
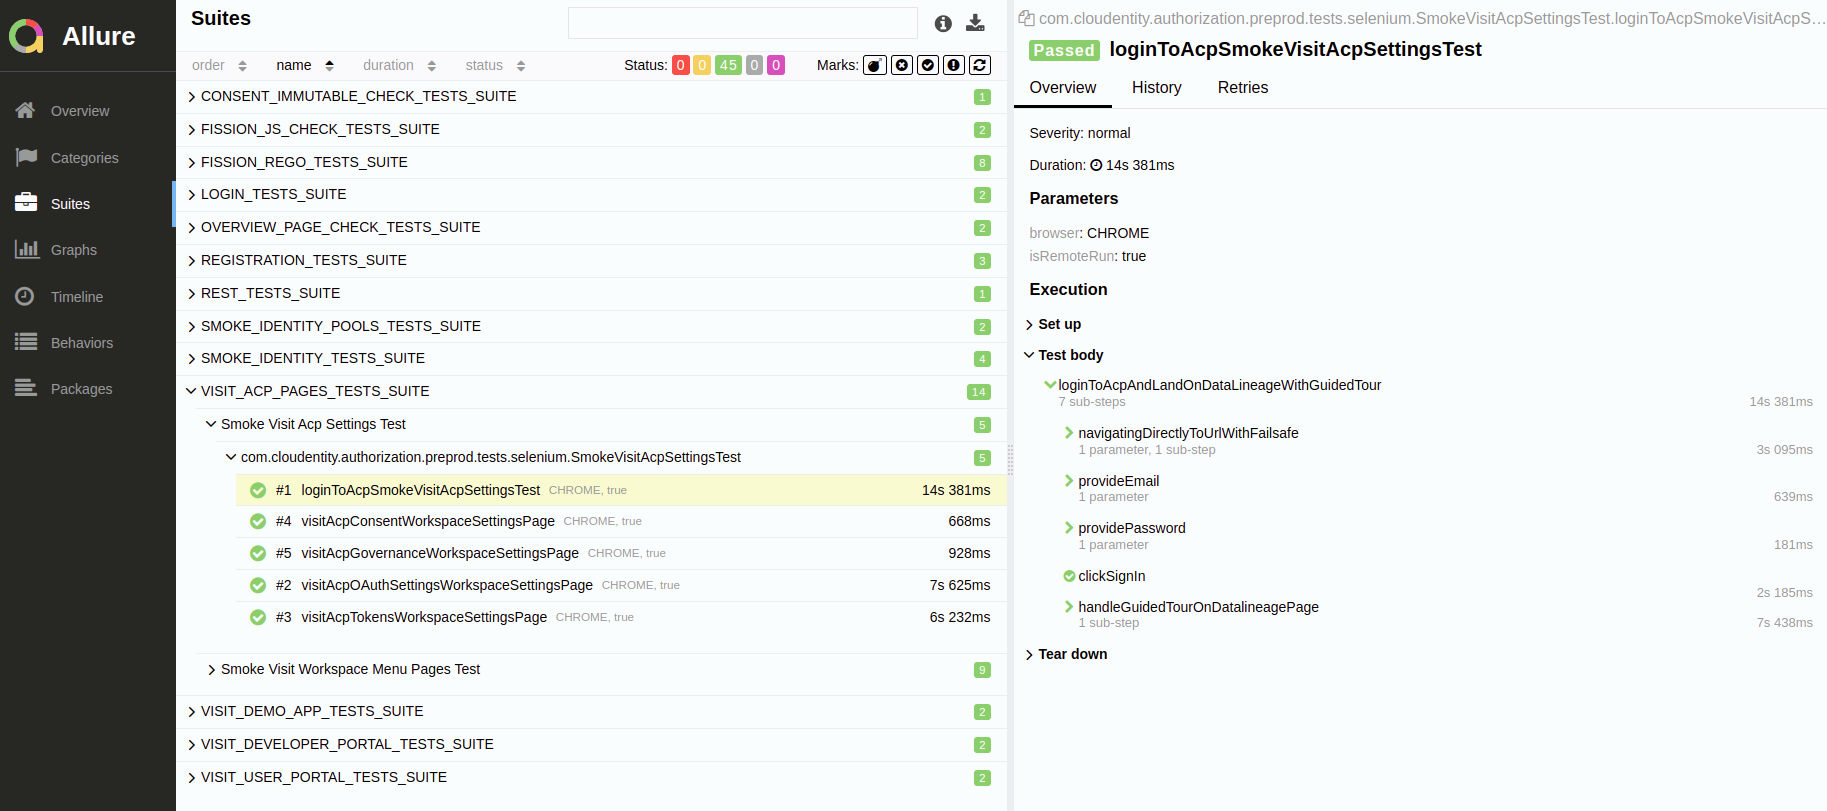
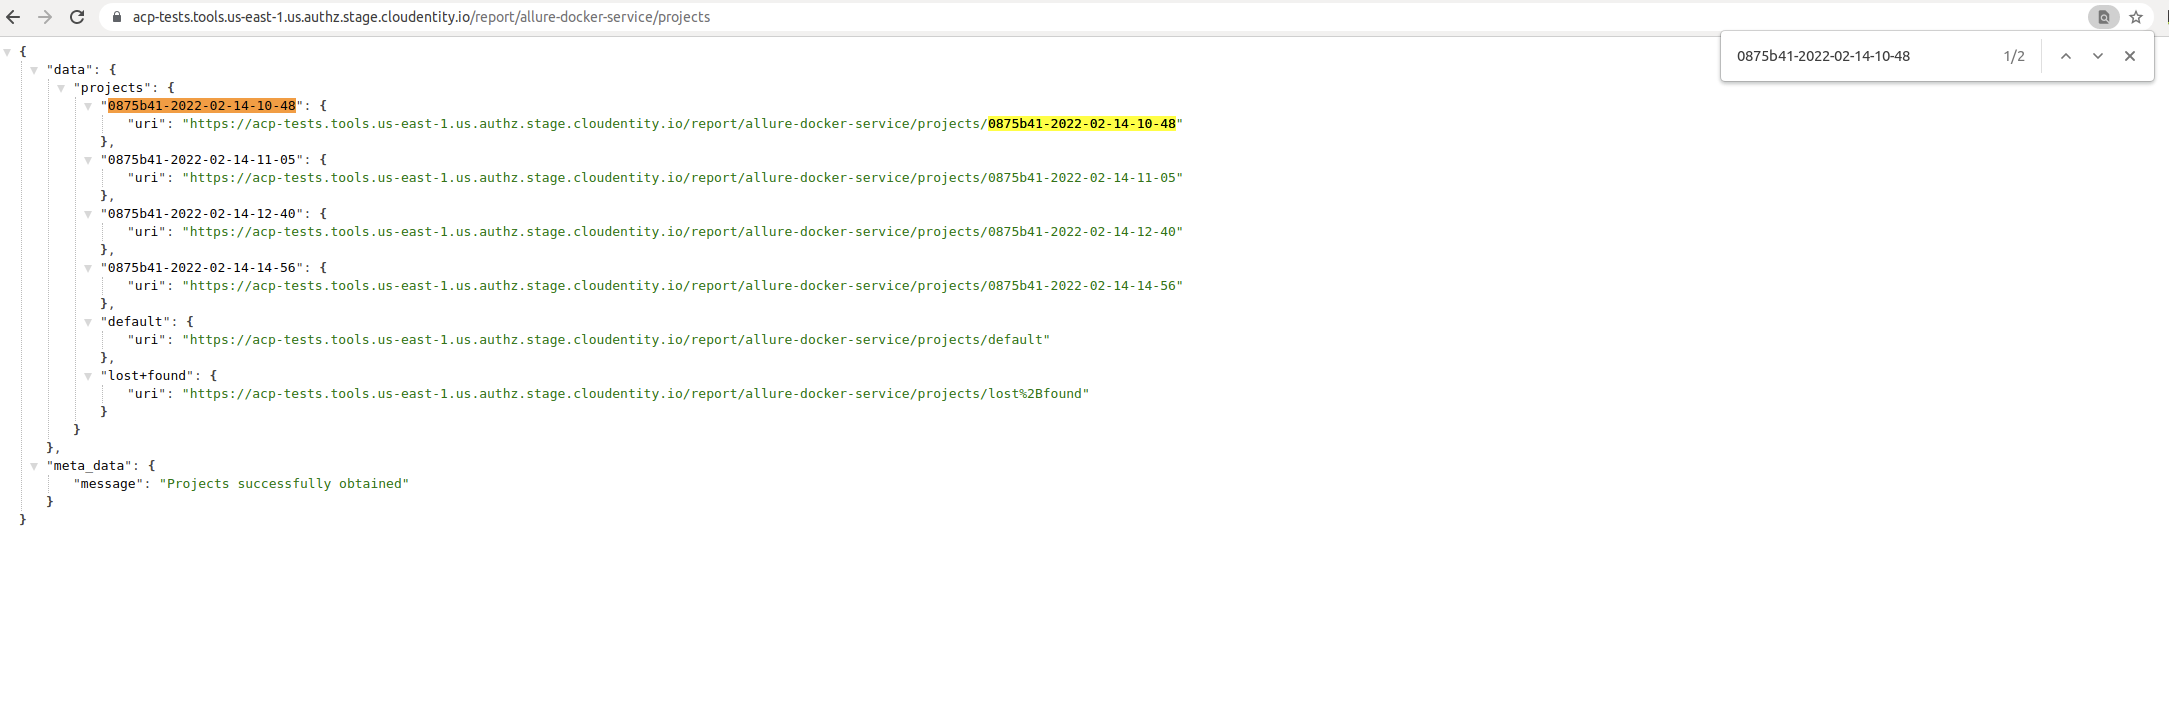
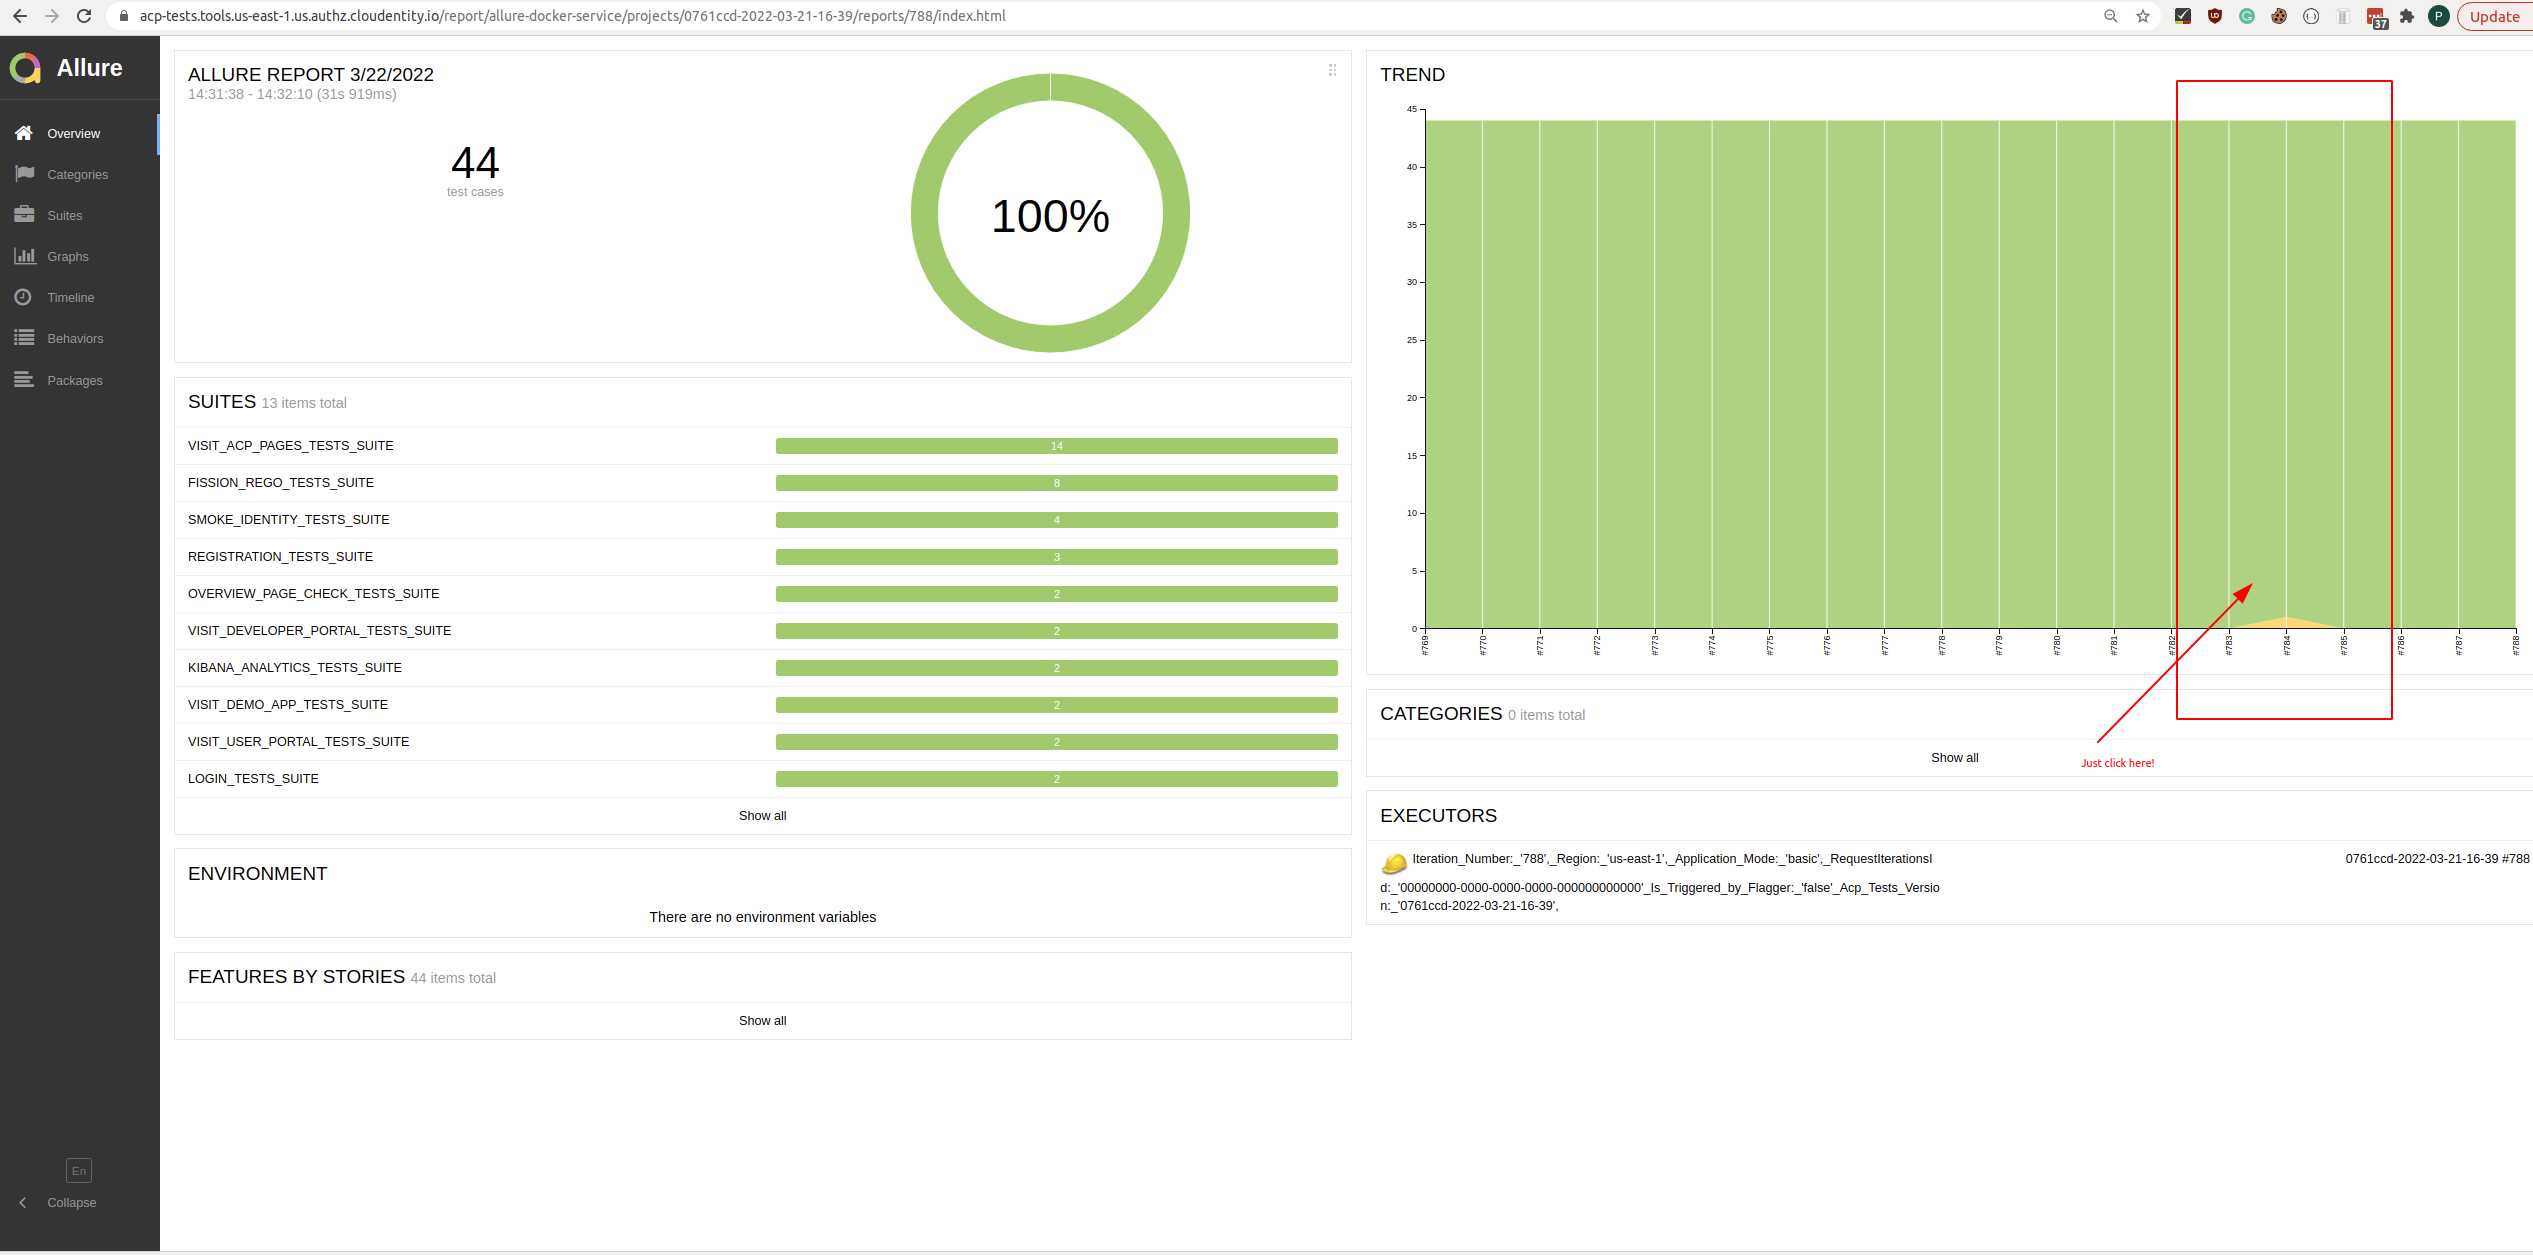
Dynamically Generated Allure Reports
When smoke tests are failing, we can rely on Allure Service serving Dynamically Generated Allure Reports to help us determine what is actually the root cause.
Allure Reports are based on constantly running smoke tests. After each iteration, an Allure report
is generated. With Allure reports, we’re able to gain additional information about why the tests are
failing, based on attached screenshots, request/response logs which contain useful information like
trace-id, etc. Currently, we’re persisting the history from the last 7 days. There is a
possibility to check
each iteration of tests with Allure. In order to get the appropriate report version and
iteration number, we use Grafana charts - we can easily see “red” when there are
any failures. Having these reports, we can easily navigate through the allure-docker-service.
With Allure, we can present a lot of additional information, including screenshots.
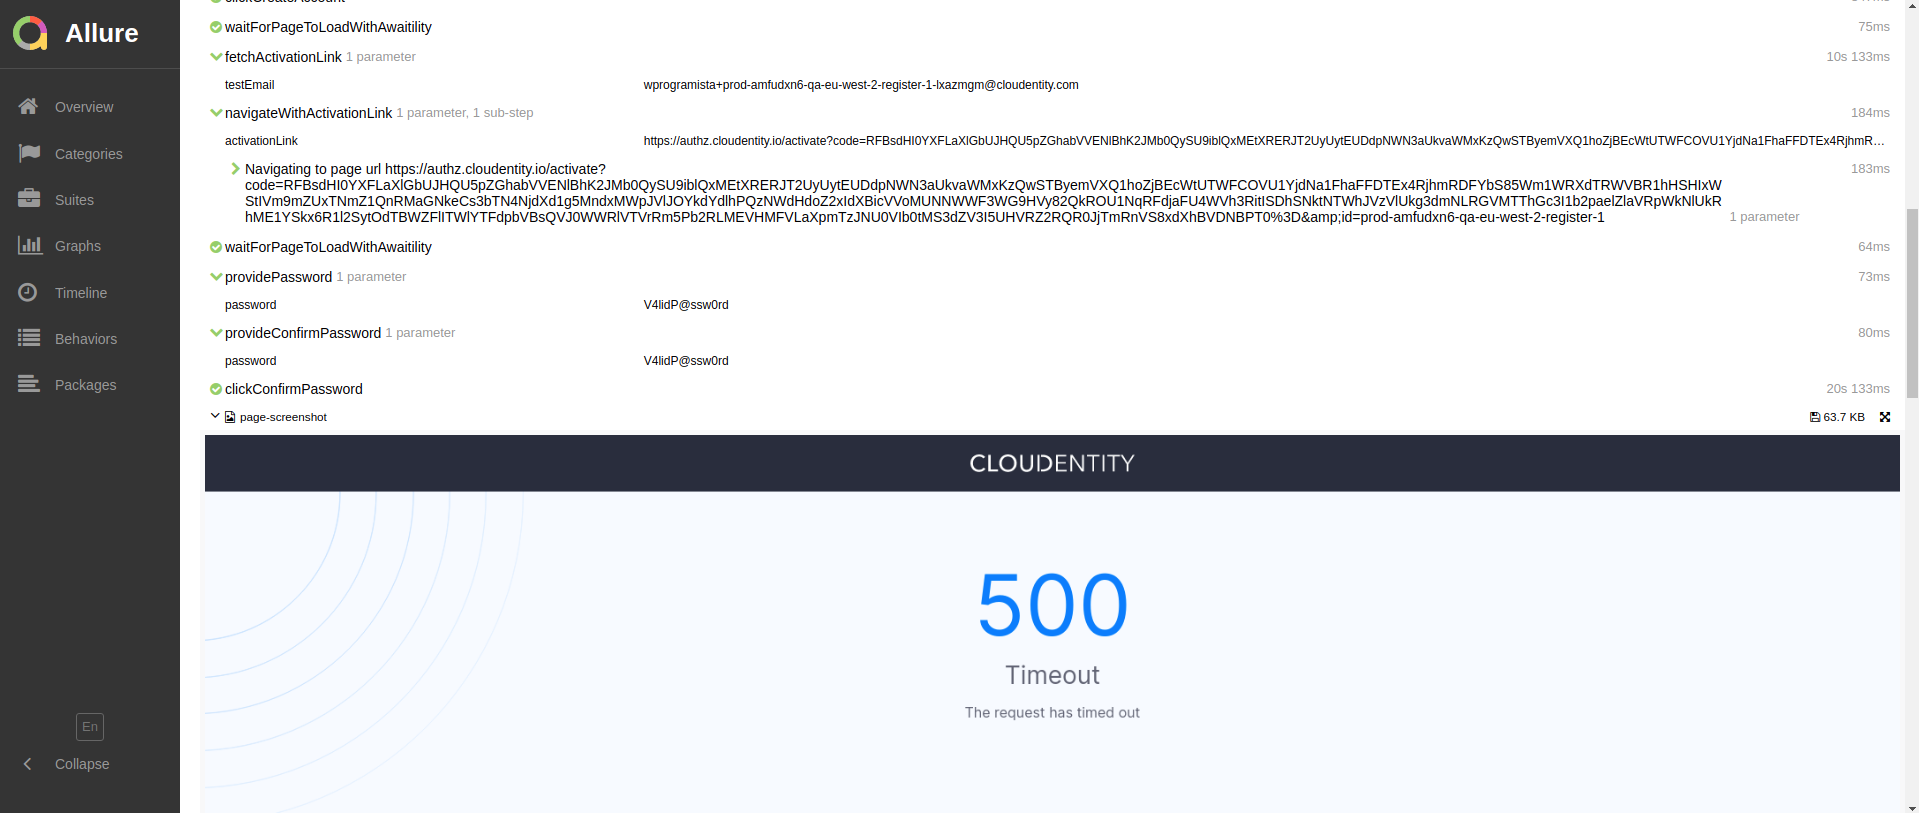
Finding the root cause is therefore made a lot easier. From attachments, we can also fetch particular
trace-id which caused the failures, and use it in Kibana’s Application Performance Monitoring
for further analysis.
Incoming Features
In this section we will let you know about our plans for the future.
Selenium Grid v4
In the near future, we’d like to migrate from a standalone-chrome (Selenium v3) container to a Selenium grid with nodes in version v4 Selenium Grid Components. First, we’d like to spawn Selenium Hub + a few Selenium nodes inside our infrastructure. We’ll use the official Selenium helm charts for that. In our Kubernetes, we’re using Flux. There is a possibility to use Flux with custom Kubernetes resources, such as:
-
HelmRelease Helm Releases
-
GitRepository Manage Helm Releases
With that stack, we’ll be ready to easily deploy and scale Selenium v4.
Backward Compatible Tests
Soon, we’d like to deploy true Canary Releases with Flagger Deployment
Strategies. Some traffic will
be then shifted toward canary services. The acp-tests application should fetch the product version
in an intelligent way
and use the appropriate assertions depending on the version. The UI in the previous version and the
canary version can vary. We’ll handle that case to be more confident
about the quality during Canary Releases and acp-tests will provide appropriate metrics.
Automated PROD deployment
In the future, we plan to automate the process of triggering Jenkins promote pipeline, which is currently ran manually. The intended behavior is to have at least one PROD deployment every day.
Conclusion
Cloudentity is consistently monitored for quality using smoke tests. We are actively applying the industry-standard best practices and always working on improving our smoke tests further.
Like what you see? Register for free to get access to a Cloudentity tenant and start exploring our platform!