Timescaledb Monitoring
TimescaleDB monitoring is crucial for ensuring optimal performance and reliability of your time-series database. By tracking vital metrics like CPU usage, query performance, and disk space, monitoring allows you to identify bottlenecks, anticipate issues, and maintain data integrity.
As mentioned in Monitoring at Cloudentity article, our system is made up of local Thanos clusters and central Grafana instance. Thanos searches for PodMonitor or ServiceMonitor of a particular component.
Note
For a complete and ready-to-use solution, consider exploring our Cloudentity on Kubernetes via the GitOps approach. Get started with our quickstart guide, and delve deeper with the deployment configuration details.
Installation
Thanks to the built-in features: Prometheus Postgres Exporter and PodMonitor available
in the Timescaledb Helm Charts you can monitor database.
To get started, you can follow these simple steps:
-
Enable PostgreSQL Exporter:
In the Helm Chart configuration file values.yaml enable
Prometheus Postgres Exporter:prometheus: enabled: true -
Enable PodMonitor:
In the same file values.yaml enable
PodMonitor:podMonitor: enabled: false -
When deployment is sucessfull in the local Thanos you should be able to see the
/metricsoffered by Prometheus Postgres Exporter:# HELP pg_settings_timescaledb_bgw_launcher_poll_time Launcher timeout value in milliseconds # TYPE pg_settings_timescaledb_bgw_launcher_poll_time gauge pg_settings_timescaledb_bgw_launcher_poll_time # HELP pg_settings_timescaledb_disable_load Disable the loading of the actual extension # TYPE pg_settings_timescaledb_disable_load gauge pg_settings_timescaledb_disable_load # HELP pg_settings_timescaledb_enable_2pc Enable two-phase commit # TYPE pg_settings_timescaledb_enable_2pc gauge pg_settings_timescaledb_enable_2pc # HELP pg_settings_timescaledb_max_open_chunks_per_insert Maximum open chunks per insert # TYPE pg_settings_timescaledb_max_open_chunks_per_insert gauge pg_settings_timescaledb_max_open_chunks_per_insert (...) # HELP pg_settings_timescaledb_osm_disable_load Disable the loading of the actual extension # TYPE pg_settings_timescaledb_osm_disable_load gauge pg_settings_timescaledb_osm_disable_load # HELP pg_settings_timescaledb_restoring Install timescale in restoring mode # TYPE pg_settings_timescaledb_restoring gauge pg_settings_timescaledb_restoring
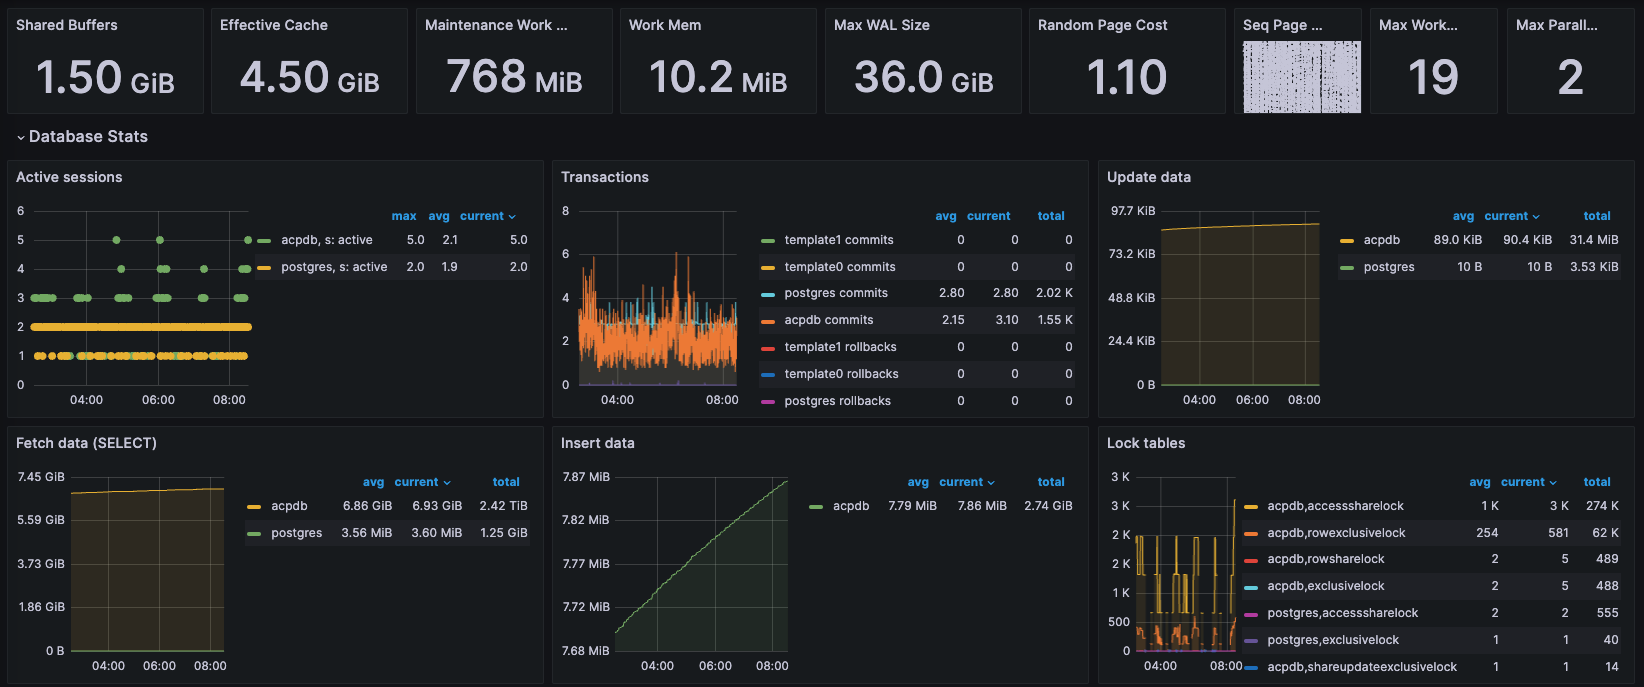
Visualisation
When data is collected by local Thanos, your Grafana can be used for visualizing the scraped data. We recommend PostgreSQL Database dashboard, which seamlessly works with the postgres_exporter. This dashboard can be easily adjusted to meet your specific needs.