Monitoring at Cloudentity
Monitoring is a critical aspect for us at Cloudentity, playing a key role in our SRE, DevOps, and Support operations across diverse infrastructures. Finding an ideal solution was challenging, requiring careful consideration of various factors including system architecture and configuration. This article outlines how we utilize Thanos to store Prometheus metrics for an EKS Multi-Cluster AWS EKS-based setup. Additionally, we’ve provided ready-to-use monitoring configurations to ensure effective Cloudentity monitoring within your infrastructure.ion.
Requirements
Here are some assumptions we wanted our monitoring system to support:
- We needed a centralized observability system to collect data from all regions' clusters (and it’s able to handle a growing load)
- The infrastructure should be highly available and resilient.
- The solution should be cost-efficient.
- Collected data should be kept for at least 90 days.
- Prevent false negatives and concentrate solely on what is important.
Architecture
Components
Our monitoring system is made up of two main components:
-
We have local Thanos clusters deployed in each of our SaaS regions. These clusters are independent and store (and visualize) metrics from the AWS region where they are located.
-
The central Thanos cluster which handles alerts and gives access to the main Grafana instance (it allows us to view/visualize data from all regions in one convenient location).
Benefits
- High availability - we can still perform our SRE work even if the central Thanos cluster is down, as we can access the local clusters for critical situations. In most cases, the failure of a single region is not a problem because the central Thanos cluster still has access to data collected by local instances. It’s important to note that we store our data in S3 buckets.
- The central Grafana instance allows us to monitor our infrastructure from a holistic perspective. This is particularly crucial as our traffic can be automatically distributed across different regions depending on the user’s location.
- Our solution is cost effective as we don’t have to send all the data from local clusters to the central one. Instead, the data is stored securely in S3 buckets that are localized per region. These buckets are not dependent on our application infrastructure and are difficult to remove or destroy. Additionally, the traffic between the Central Cluster and Local Clusters is limited to alert notifications and data that our engineers request through Cental Grafana.
- Our data is stored in S3 buckets, which provides a favorable balance between performance and costs. This enables us to retain our data for a period of 90 days and more.
- The central Thanos cluster has an additional role in our company. It can monitor non-EKS-related elements, such as the state of our WAF, stats page, and official website. Additionally, this approach allows us to group alerts from different places before sending them to us via Slack or PagerDuty.
Note
For a complete and ready-to-use solution, consider exploring our Cloudentity on Kubernetes via the GitOps approach. Get started with our quickstart guide, and delve deeper with the deployment configuration details.
Installation
Info
This article focuses on configuring a simplified version of the monitoring based on the local (single) Thanos cluster, but it’s worth noting that a similar configuration can be applied to a central cluster as well.
We utilize AWS EKS, however, the solution outlined in this article can likely be implemented on any Kubernetes cluster, such as GKE, AKS, or bare-metal. It assumes that you possess a fundamental understanding of Helm and Prometheus.
We utilize two helm charts: kube-prometheus-stack which installs thanos which is installed on top of the existing Prometheus deployment.
Prerequisites
- Kubernetes 1.16+
- kubectl CLI
- Helm 3+ (configured to work with your Kubernetes cluster)
Configuration Files
Create the following files:
namespace.yaml:
apiVersion: v1
kind: Namespace
metadata:
  name: monitoring
Note
To demonstrate, we will use minio, a tool that creates easy S3-compatible storage. However, for storing production metrics, we highly recommend using AWS S3 or a similar solution.
objstorage-local.yaml (for local testing purposes):
apiVersion: v1
kind: Secret
type: Opaque
metadata:
  name: thanos-objstore
  namespace: monitoring
stringData:
  objstore.yml: |-
    type: s3
    config:
      bucket: thanos
      endpoint: thanos-minio.monitoring:9000
      access_key: admin
      secret_key: p@ssw0rd!
      insecure: true
objstorage-prod.yaml (for production purposes):
apiVersion: v1
kind: Secret
type: Opaque
metadata:
  name: thanos-objstore
  namespace: monitoring
stringData:
  objstore.yml: |-
    type: s3
    config:
      bucket: thanos-env_name-region_name
      endpoint: s3.region_name.amazonaws.com
      region: region_name
      aws_sdk_auth: true
prometheus.yaml (here you can find the list of available parameters):
alertmanager:
  enabled: false
kubeApiServer:
  enabled: false
kubeControllerManager:
  enabled: false
kubeEtcd:
  enabled: false
kubeScheduler:
  enabled: false
grafana:
  adminPassword: prom-operator
  sidecar:
    datasources:
      url: 'http://thanos-query-frontend:9090/'
fullnameOverride: prometheus
prometheus:
  thanosService:
    enabled: true
  thanosServiceMonitor:
    enabled: true
  prometheusSpec:
    thanos:
      objectStorageConfig:
        key: objstore-local.yml
        name: thanos-objstore
    serviceMonitorSelectorNilUsesHelmValues: false
    podMonitorSelectorNilUsesHelmValues: false
    ruleSelectorNilUsesHelmValues: false
    prometheusExternalLabelNameClear: true
    disableCompaction: true
thanos.yaml (here you can find the list of available parameters):
minio:
  enabled: true
  auth:
    rootUser: admin
    rootPassword: p@ssw0rd!
metrics:
  enabled: true
  serviceMonitor:
    enabled: true
  prometheusRule:
    enabled: true
    default:
      absent_rules: true
      store_gateway: true
      compaction: true
      query: true
query:
  replicaCount: 1
  dnsDiscovery:
    sidecarsService: prometheus-thanos-discovery
    sidecarsNamespace: monitoring
compactor:
  enabled: true
  retentionResolutionRaw: 7d
  retentionResolution5m: 30d
  retentionResolution1h: 90d
  persistence:
    size: 100Gi
storegateway:
  enabled: true
  persistence:
    size: 10Gi
existingObjstoreSecret: thanos-objstore
Installation
Add the prometheus-community and thanos charts repositories to Helm:
helm repo add prometheus-community https://prometheus-community.github.io/helm-charts
helm repo add thanos https://charts.bitnami.com/bitnami
helm repo update
Create a monitoring namespace:
kubectl apply -f ./namespace.yaml
namespace/monitoring created
Create an objecstore configuration:
kubectl apply -f ./objstorage-local.yaml
secret/thanos-objstore created
Install Prometheus stack:
helm install prometheus prometheus-community/kube-prometheus-stack --values ./prometheus.yaml --namespace monitoring
NAME: prometheus
LAST DEPLOYED: Mon Jan 1 00:12:30 2023
NAMESPACE: default
STATUS: deployed
REVISION: 1
NOTES:
kube-prometheus-stack has been installed. Check its status by running:
  kubectl --namespace monitoring get pods -l "release=prometheus"
After successfully installing Prometheus, you can access Grafana by going to
http://localhost:3000. However, make sure to replace “localhost” with the
appropriate IP depending on your scenario.
Note
Default Grafana username is
adminand password isprom-operator. Please remember to change those values in a production environment.
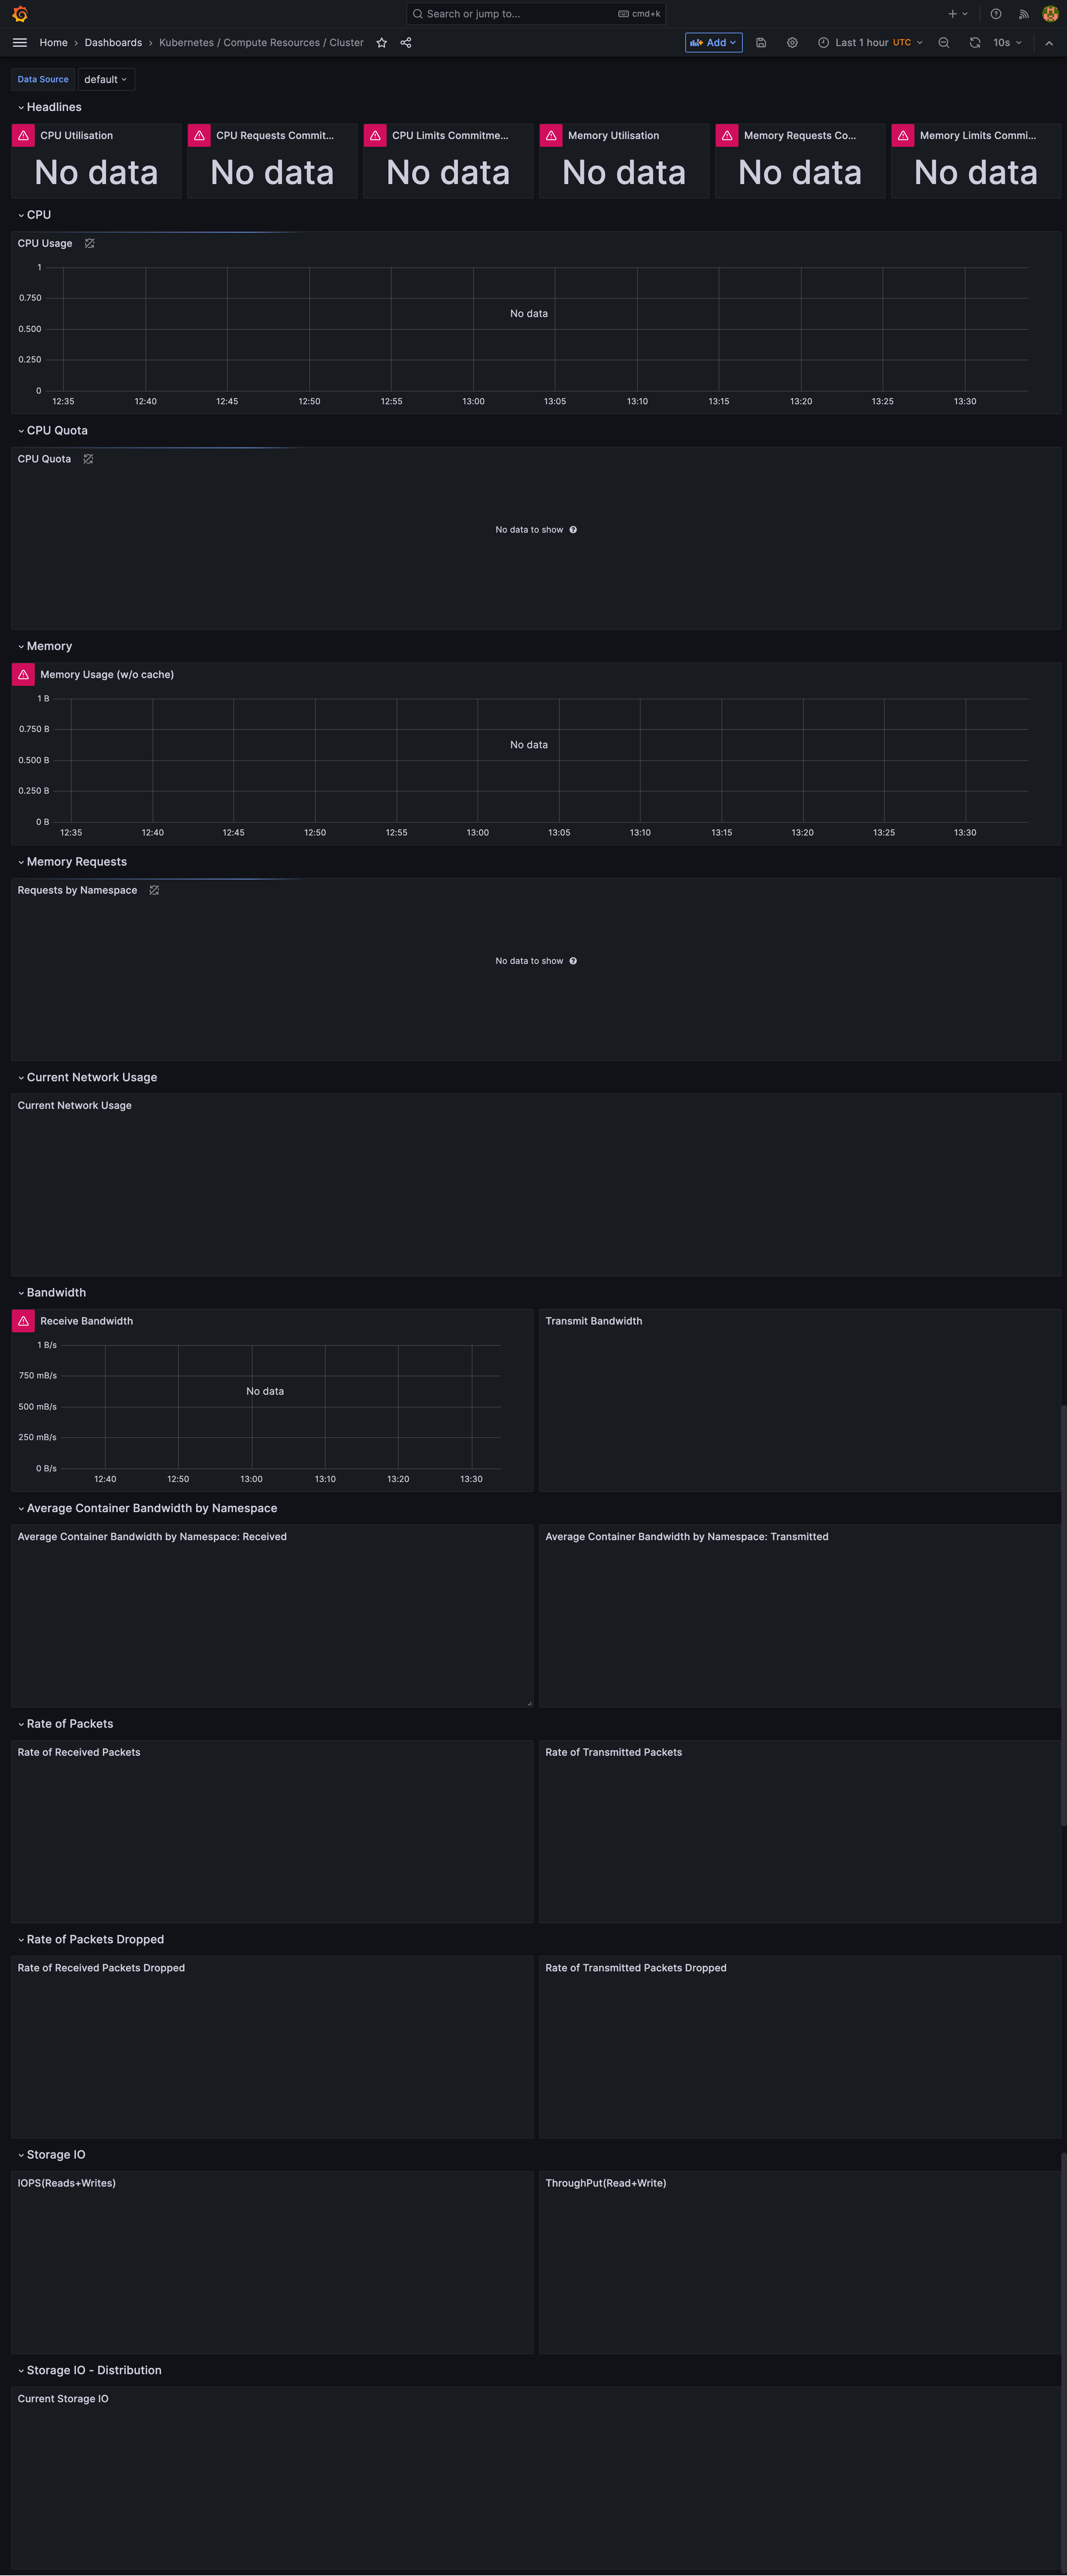
Grafana includes pre-built dashboards that allow you to monitor the current statistics of your clusters.
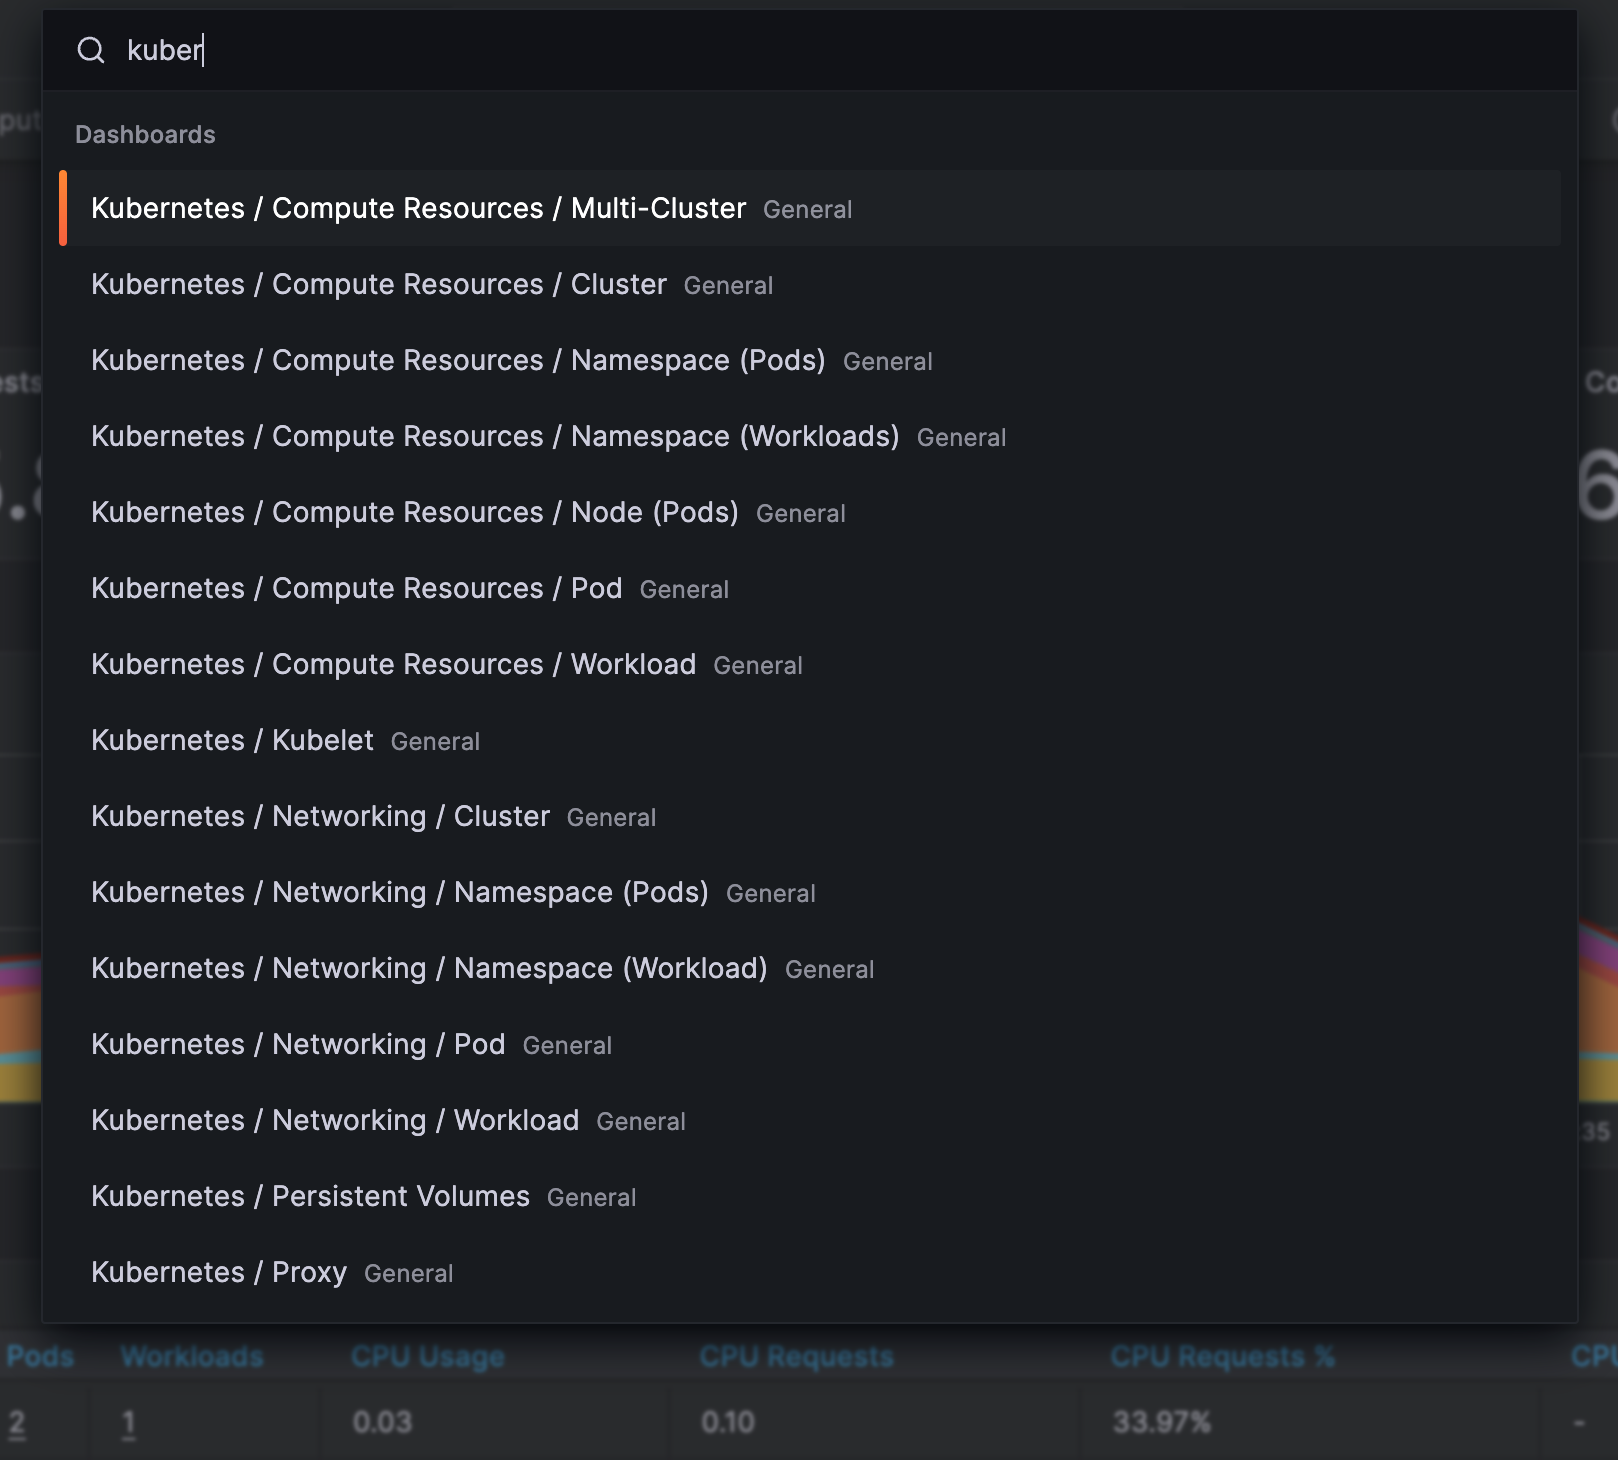
It has also preconfigured data source (Thanos Query), but as you can see by going to a randomly choosen dashboard, data is not yet visible. You can also confirm, that the data source is not passing the connection test.
Install Thanos.
helm install thanos thanos/thanos --values thanos.yaml --namespace monitoring
NAME: thanos
LAST DEPLOYED: Mon Jun 26 14:22:28 2023
NAMESPACE: default
STATUS: deployed
REVISION: 1
TEST SUITE: None
NOTES:
CHART NAME: thanos
CHART VERSION: 12.8.3
APP VERSION: 0.31.0** Please be patient while the chart is being deployed **
Thanos chart was deployed enabling the following components:
- Thanos Query
- Thanos Compactor
- Thanos Store Gateway
Thanos Query can be accessed through following DNS name from within your cluster:
thanos-query.default.svc.cluster.local (port 9090)
To access Thanos Query from outside the cluster execute the following commands:
-
Get the Thanos Query URL by running these commands:
export SERVICE_PORT=$(kubectl get --namespace default -o jsonpath="{.spec.ports[0].port}" services thanos-query) kubectl port-forward --namespace default svc/thanos-query ${SERVICE_PORT}:${SERVICE_PORT} & echo "http://127.0.0.1:${SERVICE_PORT}" -
Open a browser and access Thanos Query using the obtained URL.
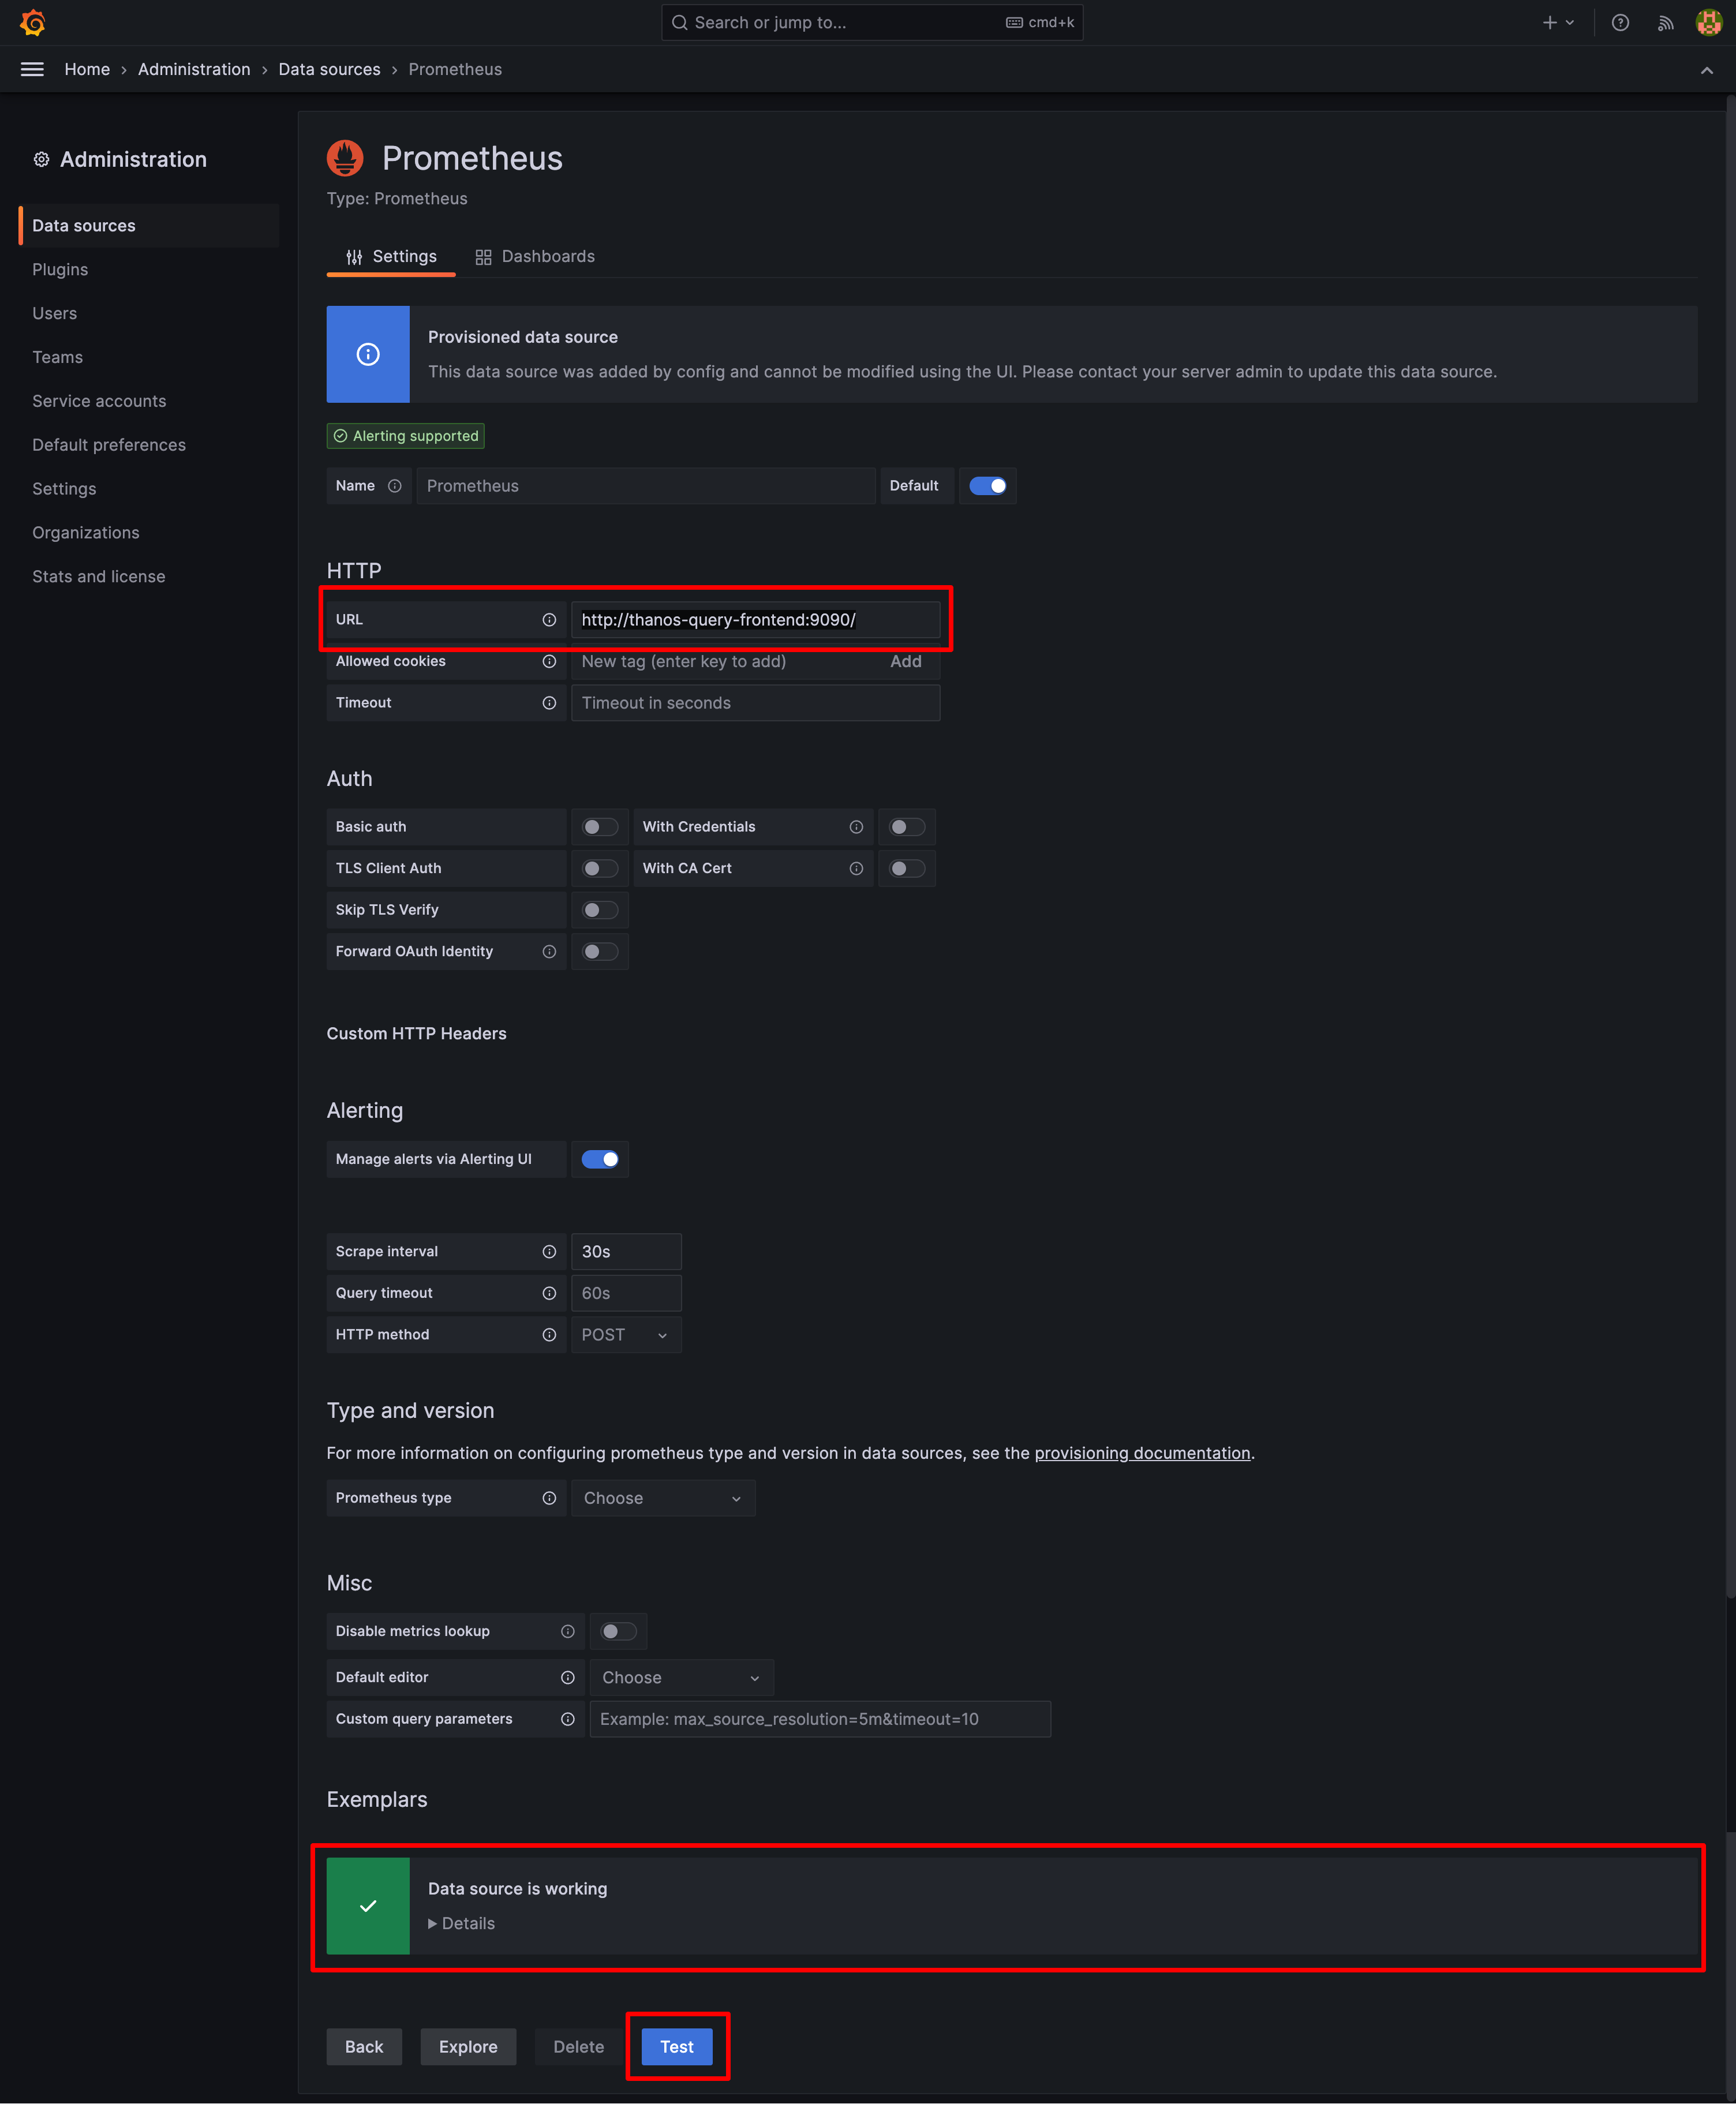
Once the Thanos is installed, you can verify connection between the Thanos Query frontend and Grafana:
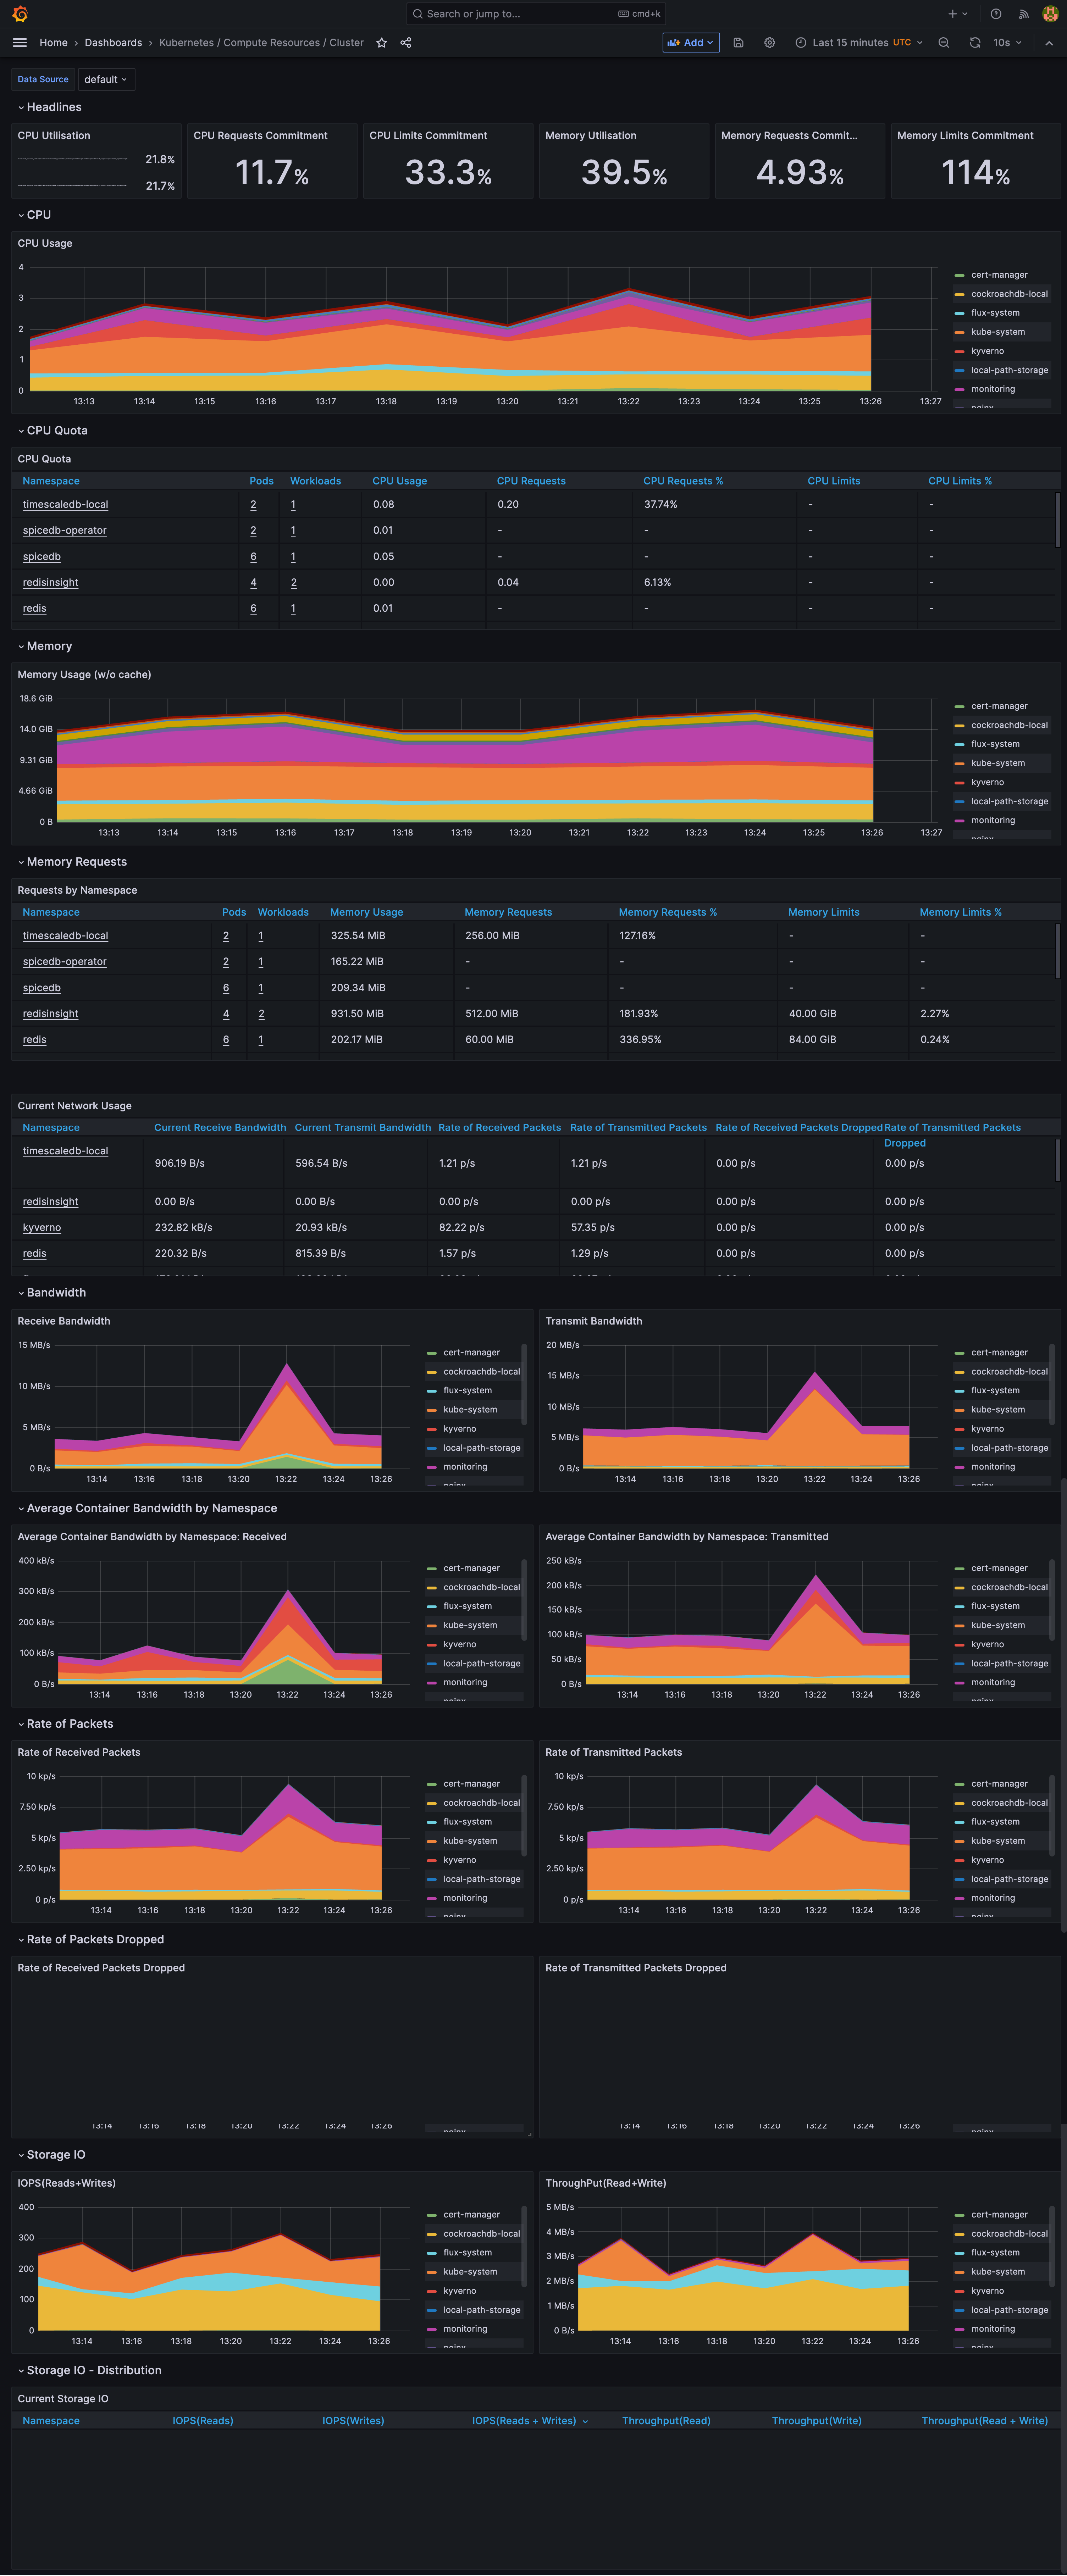
If everything looks good, you can confirm that data collected by Thanos is visible in one of predeployed Grafana dashboards:
Post-Installation Summary
You may be wondering why we chose to install Thanos alongside Prometheus. There are several reasons for this decision. Firstly, Thanos architecture is more scalable and easier to manage. Additionally, Thanos can store your cluster data on S3-compatible backends, and Collector ensures constant data aggregation for your historical data.
How to Uninstall
If you want to remove Prometheus and Thanos from your cluster, you can do so by executing:
helm uninstall thanos --namespace monitoring
helm uninstall prometheus --namespace monitoring
kubectl delete -f ./objstorage-local.yaml
kubectl delete -f ./namespace.yaml
Summary
In conclusion, Thanos helps us achieve high availability, durability, and cost-efficiency with Prometheus. While it may require substantial effort to implement Thanos and Prometheus across multiple Kubernetes clusters, the benefits of having a highly available Prometheus make it a worthwhile endeavor. This project was one of our challenging experiences, and we would have appreciated having this article as a guide when we began.