Prerequisites
- Logging solution (e.g. Elastisearch) ready to use
Configure Logging Solution
Configure HTTP endpoint, which listens for requests with audit logs from Cloudentity. For example, if you use Elasticsearch, you can use Logstash HTTP Input plugin. Here is the basic configuration of it which processes Cloudentity audit logs and sends them to Elastic Cloud:
input {
    http {
        host => "0.0.0.0"
        port => "<port number>"
        codec => json
    }
}
filter {
    split {
        field => "audit_events"
    }
    mutate {
        remove_field => [ "audit_events" ]
        add_field => {
            "message" => "%{[audit_events]}"
        }
        remove_field => [ "audit_events" ]
    }
    json {
        source => "message"
    }
}
output {
    elasticsearch {
        cloud_id => "<cloud id>"
        api_key => "<api key>"
    }
}
The input section contains the configuration of the endpoint dedicated to listening for incoming audit logs.
Click here for more information
about the http input plugin.
The filter section splits the audit_events array of the JSON payload into separate log entries.
It also removes the original JSON payload from each particular log entry to reduce data duplication.
Click here for more details about filter plugins.
The output parameter points to your Elastic Cloud. Click here
for more information about elasticsearch output. Optionally, it can point to a self-hosted Elasticsearch
installation, as described in the first chapter of this article.
Whatever solution you choose, it must be available for Cloudentity public IPs at some URL (logging endpoint URL) so that Cloudentity can reach it.
Cloudentity sends audit events in JSON batches, i.e.:
{
    "audit_events": [
        {
            "tenant_id": "example",
            "server_id": "demo",
            "event_id": "a6ea34a8ef24cfdb74da4ff9f3cb693e",
            ...
        },
        {
            "tenant_id": "example",
            "server_id": "demo",
            "event_id": "474cf3eeaf2a4f34a8e2dbf9c69b7ddf",
            ...
        },
        ...
    ]
}
which imposes the need to split the payload into individual log entries. That is why the filter part
of the above example is crucial.
Add Webhook in Cloudentity
Integrate Cloudentity with the logging solution configured in the previous section by creating a webhook.
Visualizing and Analyzing Logs
This section provides a set of best practices for visualizing and exploring collected logs using Kibana.
Leverage Kibana’s Visualization Tools
Kibana offers a suite of visualization tools, including bar charts, pie charts, line graphs, heat maps, and more. Use these tools to create meaningful visual representations of your data.
Some best practices for visualizations include:
- Use line charts for time-series data to understand trends over time.
- Use bar charts for comparing quantities across different categories.
- Use pie charts to understand proportions and distributions.
Remember, the goal of a visualization is to make the data easy to understand. So, choose the type of visualization that best conveys the meaning of your data.
Example Visualization
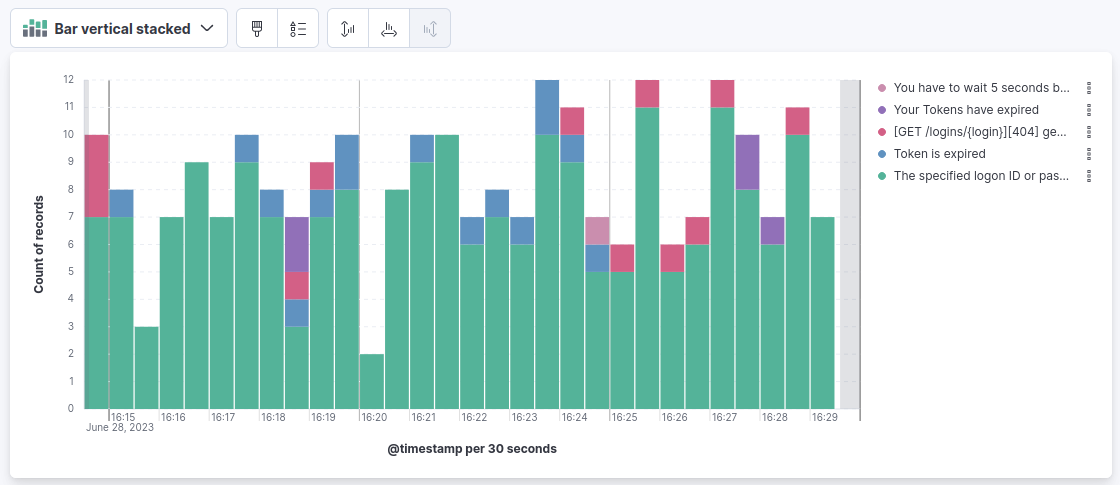
Follow these steps to create an example visualization presenting failed login causes over time:
- In Kibana, go to Analytics » Visualize Library » Create visualization button
- Select the Lens type.
- Choose Bar vertical stacked in the Visualization type dropdown.
- On the left side, add two fields to the Selected fields set:
@timestampjson.fields.msg.audit_events.payload.login_failed.cause
- Select Save
- Type Failed login causes in the name field and select Save
The visualization should look like this:
Create and Use Dashboards
A dashboard is a collection of visualizations, searches, and maps that you can use to analyze and present your data. You can create dashboards that provide an overview of your log data and allow you to drill down into specific areas as needed.
Here are some best practices for dashboards:
- Group-related visualizations are on the same dashboard
- Keep your dashboards clean and uncluttered. Too many visualizations on a single dashboard can be overwhelming.
- Use filters and queries to narrow down the data displayed on a dashboard.
Example Dashboard
Follow these steps in Kibana to create an example dashboard:
- Go to Analytics » Dashboards » Create dashboard » Add from library.
- Search for the visualization created in the previous point and select it. The visualization should appear on the dashboard.
- Resize the chart to the full width of the browser.
- Select Save, add some title for the new dashboard, and click Save again.
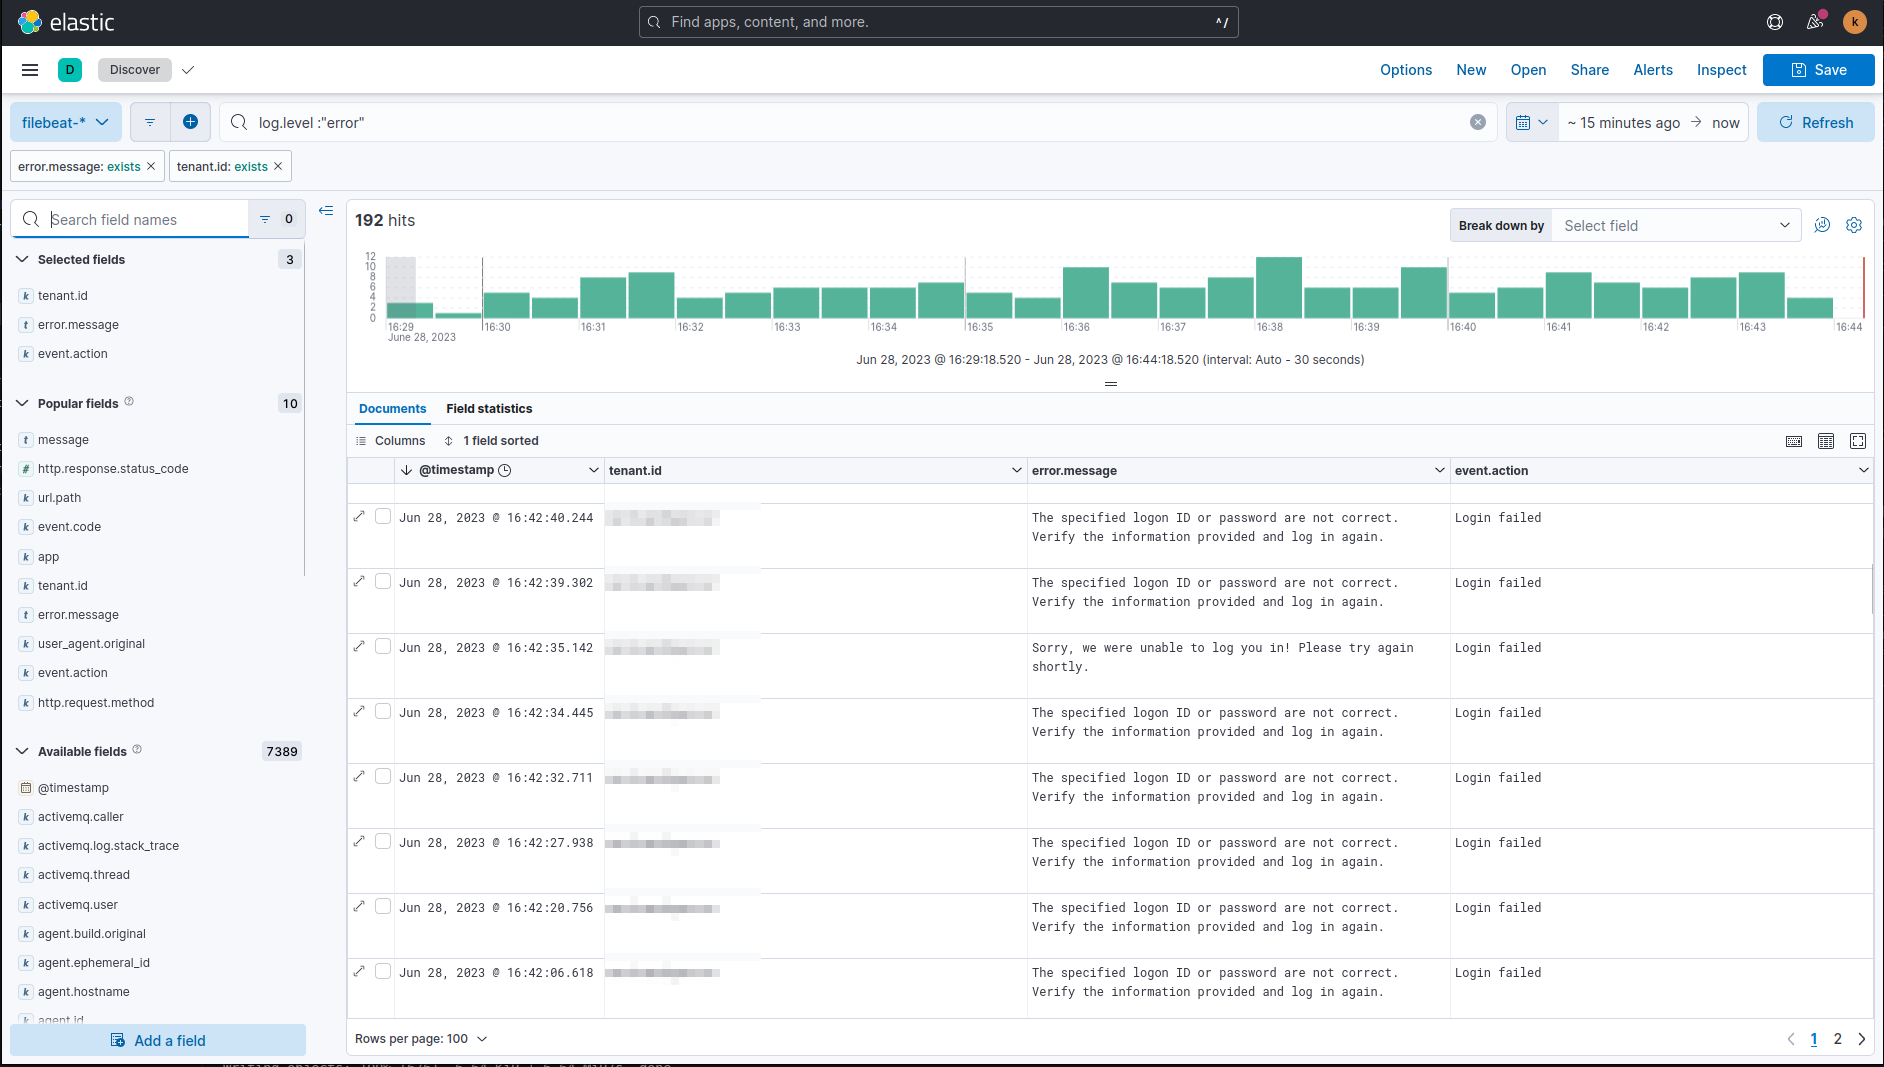
Utilize Discover Tool for Deep Dives
The Discover tool in Kibana allows you to perform deep dives on your data. You can search your data using Elasticsearch’s powerful search capabilities, view detailed information about each document, and explore your data by field.
Some best practices with Discover include:
- Use the search bar to filter your data by specific fields or values.
- Use the “Selected fields” feature to choose which fields to display in the document table.
Example Usage
- Go to Analytics » Discover.
- Type
log.level: "error"in the search bar. - On the left side, select fields:
tenant.iderror.messageevent.action
- Add more fields and set a specific time range if needed.
You can now inspect filtered log entries:
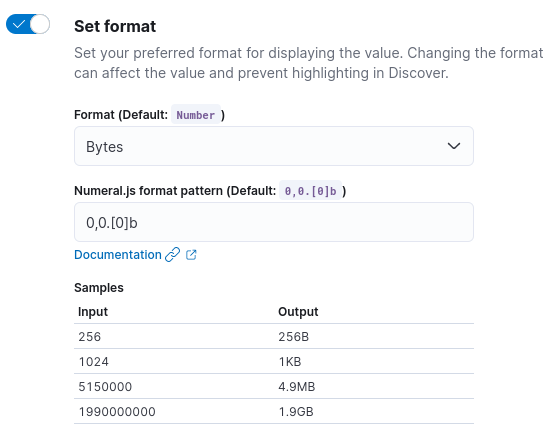
Use Field Formatters
Kibana provides several built-in field formatters. Field formatters change how the data in a field is displayed in Kibana without altering the underlying data stored in Elasticsearch.
For example, you can use field formatters to display timestamps in a human-readable format or to turn URLs into clickable links. This can make your data much easier to understand at a glance.
Example usage
- In Kibana, select Management » Stack Management » Data Views.
- Select the Cloudentity log stream
- Search for
http.request.bytesand select the edit icon on the right side. - Toogle the Set format option and select the Bytes format.
- Save.
From this point forward, whenever tje http.request.bytes is displayed, it will appear in a human-readable format:
Adopt Alerting and Anomaly Detection
Elasticsearch and Kibana support alerting and anomaly detection, which can be used to monitor your data for changes or unusual behavior. You can create alerts based on your log data and receive notifications when certain conditions are met.
Example usage
- Select Observability > Alerts » Manage Rules » Create Rule.
- Select the Log threshold option.
- Type Too many errors in the name field.
- Tweak the statement if needed.
- Select the desired action (for example, email sent).
- Save.
Limitations
Elasticsearch is a powerful, versatile, and scalable search and analytics engine, but it does come with some limitations and challenges. Here are a few key ones:
-
Resource Intensive: Elasticsearch can be resource-intensive, especially as the data volume increases. It requires a substantial amount of memory, CPU, and storage to function effectively. This can increase operational costs, particularly for large deployments.
-
Complexity: Elasticsearch has a steep learning curve. It can be complex to set up, configure, and manage, particularly for users unfamiliar with its architecture and query language.
-
Data Consistency: Elasticsearch doesn’t support ACID (Atomicity, Consistency, Isolation, Durability) properties like a traditional database. This can lead to issues with data consistency, particularly in scenarios that require immediate consistency.
-
Scaling Challenges: While Elasticsearch is built to be scalable, horizontal scaling can introduce complexity. Sharding and replication strategies need to be carefully planned and implemented. Inappropriate sharding can lead to hotspots in the cluster and hamper performance.
-
Security: Before the 7.1.0 release, key security features such as encryption, user authentication, and role-based access control were part of the paid Elastic Stack features. While these features are now included in the free version, users of earlier versions might need to implement additional layers of security.
-
Real-Time, but Not Exactly: Elasticsearch is often termed as a real-time search and analytics engine, but it’s more accurately ‘near real-time’. The time delay (usually one second) between indexing a document and it becoming searchable is called refresh interval, which might not be ideal for applications requiring immediate searchability after write operations.
-
Backup and Recovery: Elasticsearch’s backup utility, Snapshot, and Restore, can be complex to configure and manage, especially in large-scale, distributed environments.
-
No Built-in Graphical Interface: Elasticsearch is predominantly a command-line tool. While Kibana can provide a UI for data visualization and management tasks must be installed and configured separately.
Conclusion
Elasticsearch, when combined with Kibana, provides powerful tools for visualizing and analyzing log data. By following these best practices, you can make the most of these tools, allowing you to gain deep insights into your logs and understand the behavior and performance of your systems.